Personal Finance
Ranked: The Best U.S. States for Retirement


Ranked: The Best U.S. States for Retirement
What is the most important aspect of retirement planning?
If you said finances, you’re probably right. But have you ever thought about where the best place is to retire? Being strategic about location can make a big impact on your quality of life, and perhaps help your savings go just a bit further.
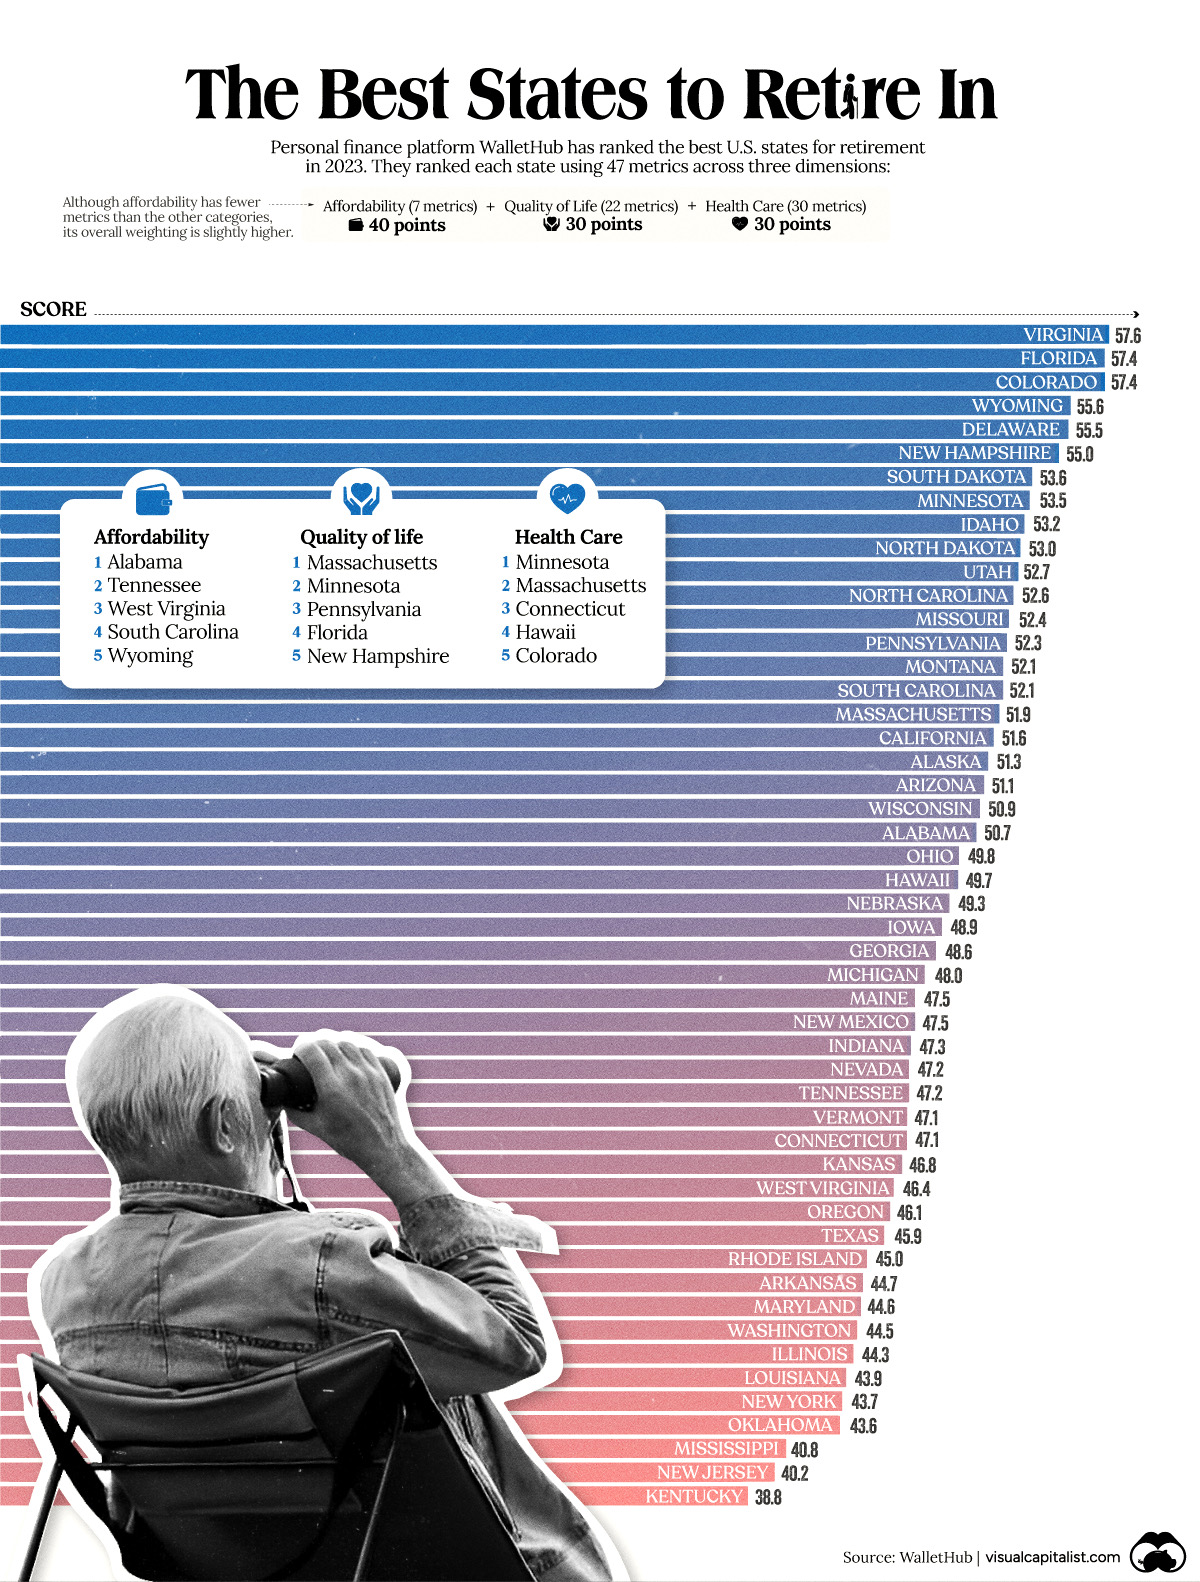
To help break it down, we’ve visualized data from personal finance platform, WalletHub, which ranked the best U.S. states for retirement as of 2023.
Data and Methodology
WalletHub ranked each state using 47 metrics across three dimensions.
- Affordability (7 metrics worth 40 points)
- Quality of Life (22 metrics worth 30 points)
- Health Care (18 metrics worth 30 points)
Here are some examples of what each dimension measures:
- Affordability: Cost of living and taxation
- Quality of Life: Quality of elder-abuse protections and crime rates
- Health Care: Number of health professionals per capita and life expectancy
Visit the source for the full list of metrics.
The final scores (visualized as the bars in the infographic above) represent each state’s weighted average across all metrics. See below for more comprehensive results.
| Rank | State | Score | Affordability (rank) | Quality of Life (rank) | Health Care (rank) |
|---|---|---|---|---|---|
| 1 | Virginia | 57.6 | 16 | 11 | 11 |
| 2T | Florida | 57.4 | 9 | 4 | 28 |
| 2T | Colorado | 57.4 | 14 | 27 | 5 |
| 4 | Wyoming | 55.6 | 5 | 9 | 38 |
| 5 | Delaware | 55.5 | 6 | 33 | 18 |
| 6 | New Hampshire | 55.0 | 31 | 5 | 7 |
| 7 | South Dakota | 53.6 | 25 | 30 | 9 |
| 8 | Minnesota | 53.5 | 40 | 2 | 1 |
| 9 | Idaho | 53.2 | 15 | 17 | 31 |
| 10 | North Dakota | 53.0 | 22 | 25 | 20 |
| 11 | Utah | 52.7 | 20 | 24 | 26 |
| 12 | North Carolina | 52.6 | 12 | 23 | 35 |
| 13 | Missouri | 52.4 | 17 | 28 | 32 |
| 14 | Pennsylvania | 52.3 | 36 | 3 | 12 |
| 15T | Montana | 52.1 | 24 | 15 | 29 |
| 15T | South Carolina | 52.1 | 4 | 38 | 39 |
| 17 | Massachusetts | 51.9 | 47 | 1 | 2 |
| 18 | California | 51.6 | 32 | 19 | 10 |
| 19 | Alaska | 51.3 | 26 | 36 | 8 |
| 20 | Arizona | 51.1 | 18 | 35 | 25 |
| 21 | Wisconsin | 50.9 | 34 | 14 | 17 |
| 22 | Alabama | 50.7 | 1 | 44 | 50 |
| 23 | Ohio | 49.8 | 27 | 8 | 37 |
| 24 | Hawaii | 49.7 | 38 | 29 | 4 |
| 25 | Nebraska | 49.3 | 37 | 16 | 15 |
| 26 | Iowa | 48.9 | 35 | 12 | 24 |
| 27 | Georgia | 48.6 | 7 | 40 | 42 |
| 28 | Michigan | 48.0 | 29 | 18 | 36 |
| 29T | Maine | 47.5 | 43 | 6 | 13 |
| 29T | New Mexico | 47.5 | 21 | 46 | 30 |
| 31 | Indiana | 47.3 | 23 | 31 | 40 |
| 32T | Nevada | 47.2 | 11 | 42 | 41 |
| 32T | Tennessee | 47.2 | 2 | 48 | 45 |
| 34T | Vermont | 47.1 | 48 | 7 | 6 |
| 34T | Connecticut | 47.1 | 44 | 26 | 3 |
| 36 | Kansas | 46.8 | 30 | 32 | 33 |
| 37 | West Virginia | 46.4 | 3 | 43 | 49 |
| 38 | Oregon | 46.1 | 41 | 21 | 21 |
| 39 | Texas | 45.9 | 28 | 37 | 34 |
| 40 | Rhode Island | 45.0 | 39 | 39 | 14 |
| 41 | Arkansas | 44.7 | 8 | 49 | 44 |
| 42 | Maryland | 44.6 | 46 | 20 | 19 |
| 43 | Washington | 44.5 | 45 | 13 | 23 |
| 44 | Illinois | 44.3 | 42 | 22 | 27 |
| 45 | Louisiana | 43.9 | 13 | 45 | 47 |
| 46 | New York | 43.7 | 50 | 10 | 16 |
| 47 | Oklahoma | 43.6 | 19 | 47 | 43 |
| 48 | Mississippi | 40.8 | 10 | 50 | 48 |
| 49 | New Jersey | 40.2 | 49 | 34 | 22 |
| 50 | Kentucky | 38.8 | 33 | 41 | 46 |
According to this methodology, Virginia is currently the best state for retirement. Although the Southeastern state does not excel in any one dimension, it scores consistently well across all three to create a very balanced retirement profile.
This gives it a slight advantage over second place Florida, which excels in quality of life and affordability, but falls further behind in terms of health care. Third-placed Colorado is a mirror of Florida, offering excellent health care but a lower quality of life in comparison.
How to Interpret These Results
It’s important to remember that this ranking is purely based on data and the methodology above, and may not be tailored to your individual preferences.
For example, if you believe that health services will be very important during retirement, you may rank Minnesota (#1 in terms of health care) much higher than eighth place.
You may notice that prioritizing one dimension will often come at a trade-off in others. Looking at Minnesota once more, we can see that the state is also one of America’s most expensive.
Looking to retire outside of the U.S.? Check out this graphic on the top 25 countries to retire in.


Money
Where People Borrow Money From, by Country Income Level
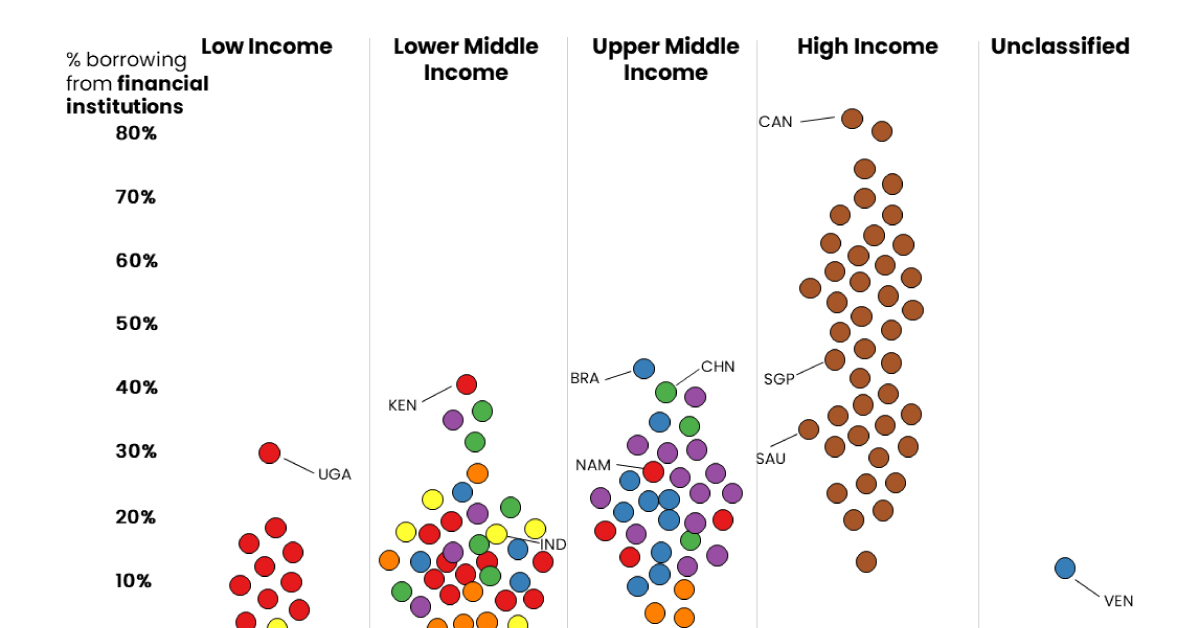
These graphics shed light on which people borrow money from financial institutions, and which rely on friends and family for monetary help.
 Creator Program
When making the decision to borrow money, do you turn to friends and family for financial help, or do you go to a financial institution like a bank or credit card company?
On a country-to-country basis, this choice often depends on a mix of various factors, including the availability of financial services, financial literacy, and the cultural approach to the very concept of lending itself.
In these graphics, Richie Lionell sheds some light on where people borrow money from, using the 2021 Global Findex Database published by the World Bank.
Borrowing From Financial Institutions
To compare borrowing practices across both location and income level, the dataset features survey results from respondents aged 15+ and groups countries by region except for high-income countries, which are grouped together.
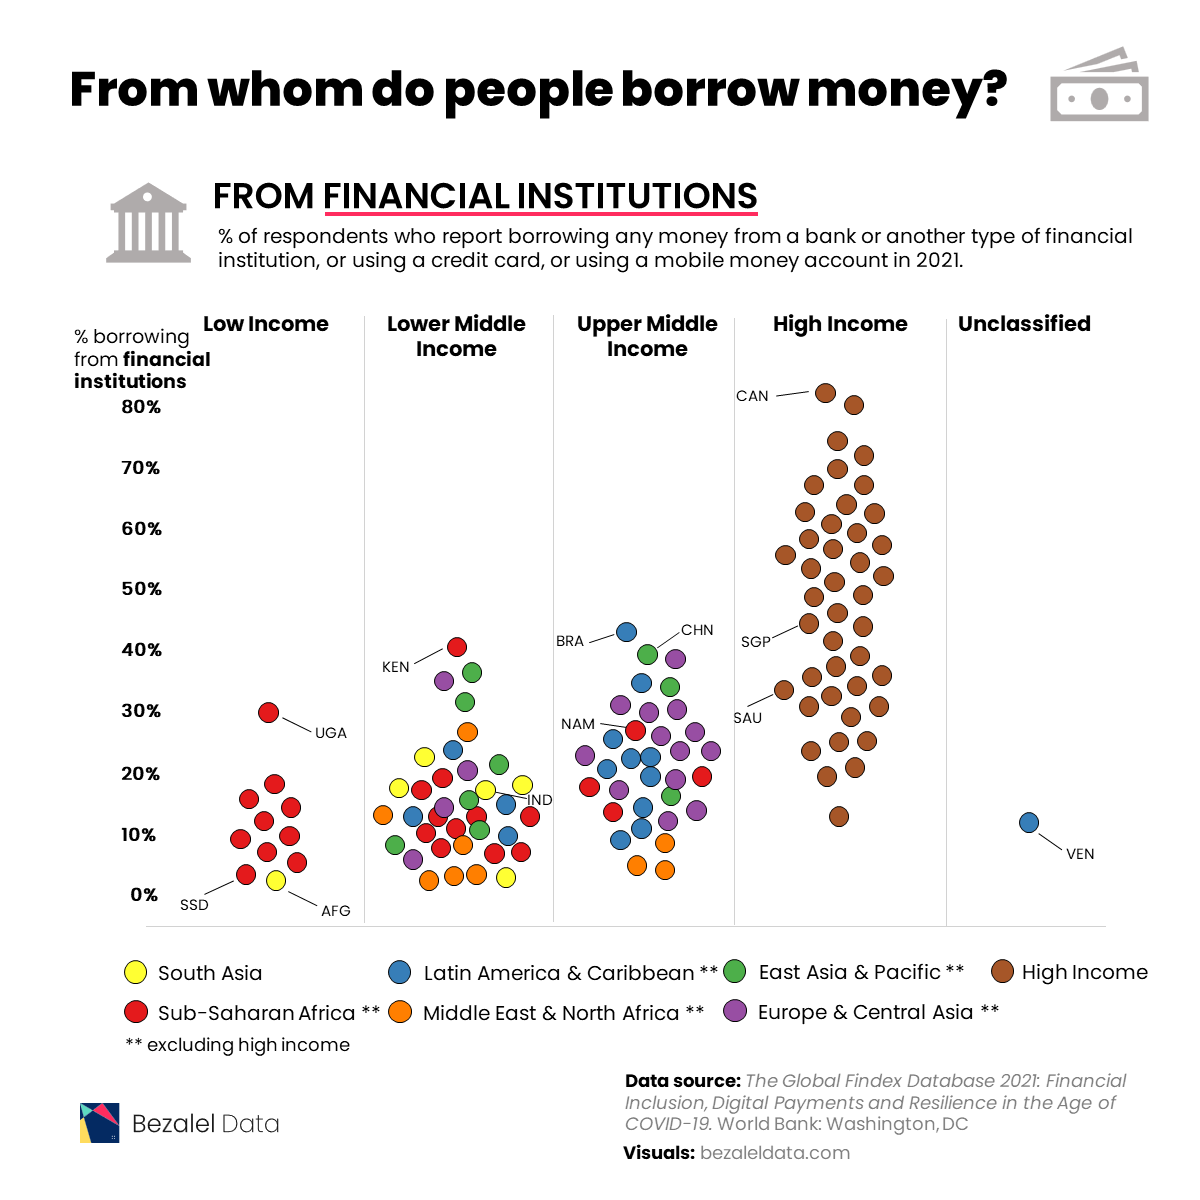
In 2021, most individuals in high income economies borrowed money from formal financial institutions.
| Country | Region | Borrowed from a financial institution |
|---|---|---|
| Canada | High income | 81.01% |
| Israel | High income | 79.52% |
| Iceland | High income | 73.36% |
| Hong Kong SAR, China | High income | 70.01% |
| Korea, Rep. | High income | 68.64% |
| Norway | High income | 66.82% |
| United States | High income | 66.21% |
| Taiwan, China | High income | 61.95% |
| Switzerland | High income | 61.40% |
| Japan | High income | 61.19% |
| New Zealand | High income | 60.38% |
| Australia | High income | 57.29% |
| Austria | High income | 56.52% |
| Italy | High income | 55.01% |
| United Kingdom | High income | 54.98% |
| Germany | High income | 54.68% |
| Ireland | High income | 54.11% |
| Denmark | High income | 53.16% |
| Finland | High income | 52.98% |
| Spain | High income | 51.92% |
| Sweden | High income | 48.69% |
| Belgium | High income | 47.98% |
| France | High income | 44.37% |
| Singapore | High income | 42.82% |
| Slovenia | High income | 42.36% |
| Uruguay | High income | 42.01% |
| Brazil | Latin America & Caribbean (excluding high income) | 40.75% |
| China | East Asia & Pacific (excluding high income) | 39.19% |
| Malta | High income | 38.95% |
| Türkiye | Europe & Central Asia (excluding high income) | 37.84% |
| Netherlands | High income | 34.45% |
| Slovak Republic | High income | 34.41% |
| Mongolia | East Asia & Pacific (excluding high income) | 34.39% |
| Ukraine | Europe & Central Asia (excluding high income) | 34.13% |
| Estonia | High income | 33.64% |
| Croatia | High income | 33.03% |
| Saudi Arabia | High income | 32.38% |
| Poland | High income | 31.92% |
| Czech Republic | High income | 31.33% |
| Cyprus | High income | 31.25% |
| Cambodia | East Asia & Pacific (excluding high income) | 30.89% |
| Argentina | Latin America & Caribbean (excluding high income) | 30.81% |
| Portugal | High income | 30.44% |
| Kazakhstan | Europe & Central Asia (excluding high income) | 29.76% |
| Russian Federation | Europe & Central Asia (excluding high income) | 29.75% |
| Thailand | East Asia & Pacific (excluding high income) | 28.26% |
| Bulgaria | Europe & Central Asia (excluding high income) | 26.36% |
| Armenia | Europe & Central Asia (excluding high income) | 26.17% |
| Iran, Islamic Rep. | Middle East & North Africa (excluding high income) | 25.11% |
| Chile | High income | 24.20% |
| Georgia | Europe & Central Asia (excluding high income) | 23.89% |
| Ecuador | Latin America & Caribbean (excluding high income) | 23.23% |
| Latvia | High income | 22.74% |
| United Arab Emirates | High income | 22.46% |
| Kenya | Sub-Saharan Africa (excluding high income) | 22.18% |
| North Macedonia | Europe & Central Asia (excluding high income) | 22.10% |
| Peru | Latin America & Caribbean (excluding high income) | 21.95% |
| Dominican Republic | Latin America & Caribbean (excluding high income) | 21.65% |
| Bosnia and Herzegovina | Europe & Central Asia (excluding high income) | 21.30% |
| Sri Lanka | South Asia | 21.29% |
| Namibia | Sub-Saharan Africa (excluding high income) | 20.97% |
| Serbia | Europe & Central Asia (excluding high income) | 20.65% |
| Greece | High income | 20.11% |
| Mauritius | Sub-Saharan Africa (excluding high income) | 20.09% |
| Bolivia | Latin America & Caribbean (excluding high income) | 19.30% |
| Romania | Europe & Central Asia (excluding high income) | 19.14% |
| Hungary | High income | 18.93% |
| Uganda | Sub-Saharan Africa (excluding high income) | 18.62% |
| South Africa | Sub-Saharan Africa (excluding high income) | 18.22% |
| Colombia | Latin America & Caribbean (excluding high income) | 18.10% |
| Kyrgyz Republic | Europe & Central Asia (excluding high income) | 17.73% |
| Kosovo | Europe & Central Asia (excluding high income) | 17.61% |
| Costa Rica | Latin America & Caribbean (excluding high income) | 17.46% |
| Philippines | East Asia & Pacific (excluding high income) | 17.45% |
| Liberia | Sub-Saharan Africa (excluding high income) | 15.42% |
| Bangladesh | South Asia | 14.22% |
| Nepal | South Asia | 14.11% |
| Malaysia | East Asia & Pacific (excluding high income) | 13.48% |
| Albania | Europe & Central Asia (excluding high income) | 13.39% |
| Moldova | Europe & Central Asia (excluding high income) | 13.18% |
| Indonesia | East Asia & Pacific (excluding high income) | 12.86% |
| Tajikistan | Europe & Central Asia (excluding high income) | 12.43% |
| Paraguay | Latin America & Caribbean (excluding high income) | 12.39% |
| Nicaragua | Latin America & Caribbean (excluding high income) | 12.19% |
| Jamaica | Latin America & Caribbean (excluding high income) | 12.04% |
| Lithuania | High income | 11.95% |
| India | South Asia | 11.79% |
| Mali | Sub-Saharan Africa (excluding high income) | 10.99% |
| El Salvador | Latin America & Caribbean (excluding high income) | 10.56% |
| Panama | Latin America & Caribbean (excluding high income) | 10.39% |
| Honduras | Latin America & Caribbean (excluding high income) | 10.32% |
| Mozambique | Sub-Saharan Africa (excluding high income) | 10.27% |
| Senegal | Sub-Saharan Africa (excluding high income) | 9.98% |
| Tunisia | Middle East & North Africa (excluding high income) | 9.89% |
| Jordan | Middle East & North Africa (excluding high income) | 9.86% |
| Lao PDR | East Asia & Pacific (excluding high income) | 9.15% |
| Venezuela, RB | Latin America & Caribbean (excluding high income) | 8.83% |
| Benin | Sub-Saharan Africa (excluding high income) | 8.21% |
| Malawi | Sub-Saharan Africa (excluding high income) | 7.99% |
| Uzbekistan | Europe & Central Asia (excluding high income) | 7.50% |
| Togo | Sub-Saharan Africa (excluding high income) | 7.42% |
| Ghana | Sub-Saharan Africa (excluding high income) | 7.40% |
| Egypt, Arab Rep. | Middle East & North Africa (excluding high income) | 7.30% |
| Myanmar | East Asia & Pacific (excluding high income) | 7.06% |
| Cameroon | Sub-Saharan Africa (excluding high income) | 6.99% |
| Zambia | Sub-Saharan Africa (excluding high income) | 6.76% |
| Burkina Faso | Sub-Saharan Africa (excluding high income) | 6.66% |
| Nigeria | Sub-Saharan Africa (excluding high income) | 6.40% |
| Congo, Rep. | Sub-Saharan Africa (excluding high income) | 6.19% |
| Guinea | Sub-Saharan Africa (excluding high income) | 6.11% |
| Gabon | Sub-Saharan Africa (excluding high income) | 5.48% |
| Morocco | Middle East & North Africa (excluding high income) | 4.99% |
| West Bank and Gaza | Middle East & North Africa (excluding high income) | 4.94% |
| Tanzania | Sub-Saharan Africa (excluding high income) | 4.45% |
| Sierra Leone | Sub-Saharan Africa (excluding high income) | 4.29% |
| Cote d'Ivoire | Sub-Saharan Africa (excluding high income) | 4.10% |
| Algeria | Middle East & North Africa (excluding high income) | 3.80% |
| Iraq | Middle East & North Africa (excluding high income) | 3.64% |
| Pakistan | South Asia | 3.51% |
| Lebanon | Middle East & North Africa (excluding high income) | 3.31% |
| Zimbabwe | Sub-Saharan Africa (excluding high income) | 2.89% |
| South Sudan | Sub-Saharan Africa (excluding high income) | 2.48% |
| Afghanistan | South Asia | 2.05% |
With 81% of respondents borrowing from financial institutions, Canada tops this list. Meanwhile, Israel (80%), Iceland (73%), Hong Kong (70%), and South Korea (69%) are not far behind.
This is not surprising for richer nations, as financial services in these countries are more available and accessible. This, coupled with higher financial literacy, including a general understanding of interest rates and credit-building opportunities, contribute to the popularity of financial institutions.
Also, it’s worth noting that some countries have cultural practices that factor in. For example, 61% of respondents in Japan used formal financial institutions, which are a more socially acceptable option than asking to borrow money from friends and family (just 6% of people in Japan).
Borrowing from Friends and Family
In contrast, more individuals in lower income economies approached family and friends in order to borrow money.
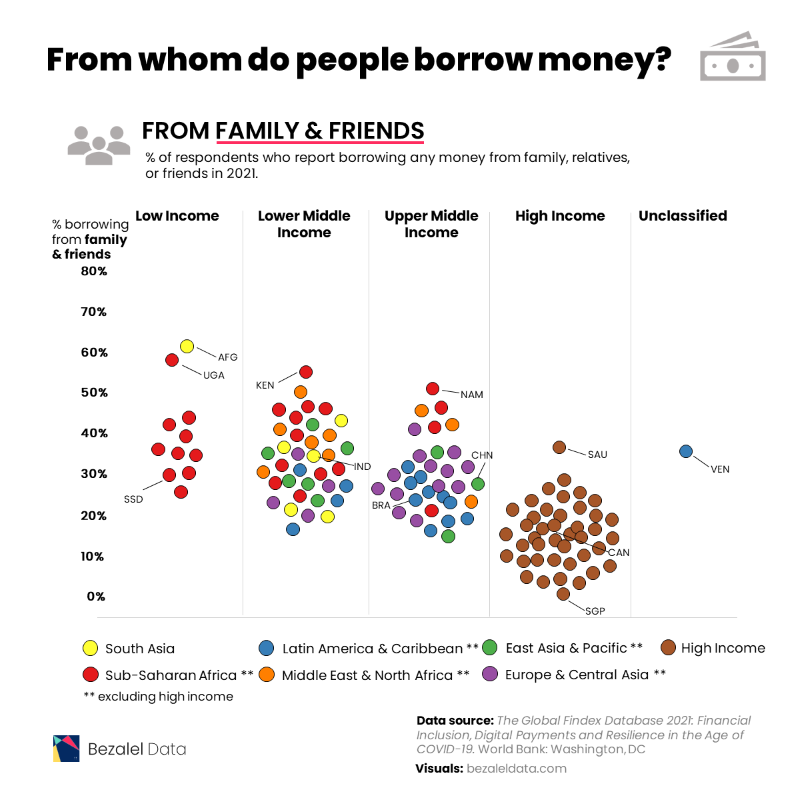
Afghanistan tops this list with 60% of respondents relying on friends and family, compared to only 2% borrowing money from formal financial institutions.
| Country | Region | Borrowed from family or friends |
|---|---|---|
| Afghanistan | South Asia | 60.18% |
| Uganda | Sub-Saharan Africa (excluding high income) | 57.45% |
| Kenya | Sub-Saharan Africa (excluding high income) | 54.40% |
| Namibia | Sub-Saharan Africa (excluding high income) | 50.25% |
| Morocco | Middle East & North Africa (excluding high income) | 48.73% |
| Nigeria | Sub-Saharan Africa (excluding high income) | 44.71% |
| South Africa | Sub-Saharan Africa (excluding high income) | 44.54% |
| Iraq | Middle East & North Africa (excluding high income) | 44.10% |
| Cameroon | Sub-Saharan Africa (excluding high income) | 43.49% |
| Zambia | Sub-Saharan Africa (excluding high income) | 43.08% |
| Zimbabwe | Sub-Saharan Africa (excluding high income) | 42.34% |
| Guinea | Sub-Saharan Africa (excluding high income) | 42.04% |
| Nepal | South Asia | 41.79% |
| Jordan | Middle East & North Africa (excluding high income) | 41.76% |
| Gabon | Sub-Saharan Africa (excluding high income) | 41.41% |
| Liberia | Sub-Saharan Africa (excluding high income) | 41.37% |
| Tunisia | Middle East & North Africa (excluding high income) | 41.05% |
| Philippines | East Asia & Pacific (excluding high income) | 40.82% |
| Türkiye | Europe & Central Asia (excluding high income) | 40.80% |
| Iran, Islamic Rep. | Middle East & North Africa (excluding high income) | 39.80% |
| Sierra Leone | Sub-Saharan Africa (excluding high income) | 39.02% |
| Ghana | Sub-Saharan Africa (excluding high income) | 38.58% |
| Egypt, Arab Rep. | Middle East & North Africa (excluding high income) | 37.75% |
| Saudi Arabia | High income | 35.76% |
| Bangladesh | South Asia | 35.49% |
| Mali | Sub-Saharan Africa (excluding high income) | 35.15% |
| Burkina Faso | Sub-Saharan Africa (excluding high income) | 35.14% |
| Cambodia | East Asia & Pacific (excluding high income) | 34.85% |
| Venezuela, RB | Latin America & Caribbean (excluding high income) | 34.81% |
| Togo | Sub-Saharan Africa (excluding high income) | 33.99% |
| West Bank and Gaza | Middle East & North Africa (excluding high income) | 33.93% |
| Thailand | East Asia & Pacific (excluding high income) | 32.83% |
| Lao PDR | East Asia & Pacific (excluding high income) | 32.36% |
| Moldova | Europe & Central Asia (excluding high income) | 32.18% |
| Ukraine | Europe & Central Asia (excluding high income) | 32.17% |
| Senegal | Sub-Saharan Africa (excluding high income) | 31.30% |
| Armenia | Europe & Central Asia (excluding high income) | 31.29% |
| India | South Asia | 31.02% |
| Bolivia | Latin America & Caribbean (excluding high income) | 30.69% |
| Algeria | Middle East & North Africa (excluding high income) | 30.52% |
| Cote d'Ivoire | Sub-Saharan Africa (excluding high income) | 30.20% |
| Albania | Europe & Central Asia (excluding high income) | 30.00% |
| Bulgaria | Europe & Central Asia (excluding high income) | 29.99% |
| Benin | Sub-Saharan Africa (excluding high income) | 29.33% |
| Mozambique | Sub-Saharan Africa (excluding high income) | 29.33% |
| Tanzania | Sub-Saharan Africa (excluding high income) | 29.24% |
| Colombia | Latin America & Caribbean (excluding high income) | 29.08% |
| Indonesia | East Asia & Pacific (excluding high income) | 28.85% |
| South Sudan | Sub-Saharan Africa (excluding high income) | 28.84% |
| Ecuador | Latin America & Caribbean (excluding high income) | 28.79% |
| Serbia | Europe & Central Asia (excluding high income) | 28.49% |
| Russian Federation | Europe & Central Asia (excluding high income) | 28.40% |
| Mongolia | East Asia & Pacific (excluding high income) | 27.01% |
| Kyrgyz Republic | Europe & Central Asia (excluding high income) | 27.01% |
| China | East Asia & Pacific (excluding high income) | 26.43% |
| Honduras | Latin America & Caribbean (excluding high income) | 26.07% |
| Greece | High income | 25.94% |
| Kosovo | Europe & Central Asia (excluding high income) | 25.86% |
| Argentina | Latin America & Caribbean (excluding high income) | 25.72% |
| Kazakhstan | Europe & Central Asia (excluding high income) | 25.64% |
| Romania | Europe & Central Asia (excluding high income) | 25.58% |
| Malawi | Sub-Saharan Africa (excluding high income) | 25.24% |
| North Macedonia | Europe & Central Asia (excluding high income) | 25.14% |
| Dominican Republic | Latin America & Caribbean (excluding high income) | 24.70% |
| Brazil | Latin America & Caribbean (excluding high income) | 24.66% |
| Congo, Rep. | Sub-Saharan Africa (excluding high income) | 24.40% |
| Lebanon | Middle East & North Africa (excluding high income) | 24.26% |
| Nicaragua | Latin America & Caribbean (excluding high income) | 23.75% |
| Iceland | High income | 23.63% |
| Peru | Latin America & Caribbean (excluding high income) | 23.34% |
| United Arab Emirates | High income | 23.04% |
| Myanmar | East Asia & Pacific (excluding high income) | 23.03% |
| Sri Lanka | South Asia | 22.53% |
| Paraguay | Latin America & Caribbean (excluding high income) | 22.20% |
| Pakistan | South Asia | 21.87% |
| Uzbekistan | Europe & Central Asia (excluding high income) | 21.53% |
| Cyprus | High income | 20.95% |
| Bosnia and Herzegovina | Europe & Central Asia (excluding high income) | 20.94% |
| Chile | High income | 20.72% |
| Georgia | Europe & Central Asia (excluding high income) | 20.61% |
| Mauritius | Sub-Saharan Africa (excluding high income) | 20.48% |
| Costa Rica | Latin America & Caribbean (excluding high income) | 20.29% |
| Jamaica | Latin America & Caribbean (excluding high income) | 20.02% |
| Tajikistan | Europe & Central Asia (excluding high income) | 19.86% |
| Poland | High income | 19.34% |
| Norway | High income | 19.29% |
| United States | High income | 18.09% |
| Uruguay | High income | 17.60% |
| Panama | Latin America & Caribbean (excluding high income) | 17.54% |
| Denmark | High income | 17.51% |
| Croatia | High income | 17.09% |
| El Salvador | Latin America & Caribbean (excluding high income) | 16.78% |
| Slovenia | High income | 16.77% |
| Latvia | High income | 16.57% |
| Australia | High income | 16.44% |
| Estonia | High income | 15.74% |
| Malaysia | East Asia & Pacific (excluding high income) | 15.44% |
| Israel | High income | 15.43% |
| New Zealand | High income | 15.19% |
| Slovak Republic | High income | 15.02% |
| Germany | High income | 15.01% |
| Austria | High income | 14.41% |
| Canada | High income | 14.00% |
| Finland | High income | 13.43% |
| Czech Republic | High income | 13.41% |
| Korea, Rep. | High income | 13.16% |
| Malta | High income | 12.99% |
| Belgium | High income | 12.13% |
| Sweden | High income | 11.79% |
| Hungary | High income | 11.15% |
| Lithuania | High income | 10.65% |
| Spain | High income | 10.44% |
| France | High income | 10.42% |
| Netherlands | High income | 10.24% |
| Ireland | High income | 9.84% |
| Taiwan, China | High income | 9.70% |
| Portugal | High income | 8.22% |
| Hong Kong SAR, China | High income | 7.59% |
| Japan | High income | 6.43% |
| Switzerland | High income | 6.10% |
| United Kingdom | High income | 5.24% |
| Italy | High income | 5.06% |
| Singapore | High income | 1.89% |
Many individuals in African countries including Uganda (57%), Kenya (54%), Namibia (50%), and Morocco (49%) also are choosing to borrow money from friends and family over financial institutions.
These preferences can be attributed to various factors including a lack of trust in banking and financial institutions, lacking access to such services, or the lack of information about such services if they are available.
And in some societies, borrowing from friends and family can be seen as a cultural norm, especially in places where mutual support and solidarity play a strong role.
What’s Next?
As viewed by the World Bank, financial inclusion is an important foundation of any nation’s development, and it’s also one of the UN’s Sustainable Development Goals. Increasing levels of financial inclusion helps give people access to services like savings plans, credit avenues, and online payments and transactions.
And thanks to commitments from countries and financial systems, global ownership of banking accounts has increased significantly (and been further spurred by the COVID-19 pandemic). According to the Global Findex Database, bank account ownership has risen to 76% in 2021, up from just 51% a decade prior.
However, access to these services is still rife with gaps when it comes to low income nations, low income individuals, and unequal access based on gender. The future of borrowing now relies on how nations deal with these challenges.

-
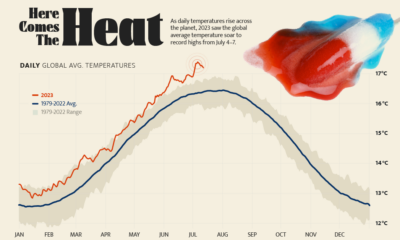
 Environment5 days ago
Hotter Than Ever: 2023 Sets New Global Temperature Records
-

 Datastream4 weeks ago
Can You Calculate Your Daily Carbon Footprint?
-
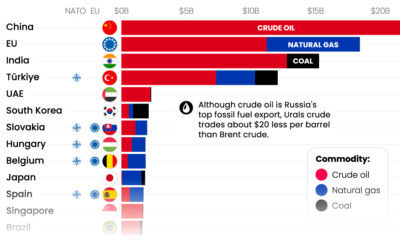
 Energy2 weeks ago
Who’s Still Buying Russian Fossil Fuels in 2023?
-

 VC+4 days ago
What’s New on VC+ in July
-

 Investor Education4 weeks ago
Visualizing BlackRock’s Top Equity Holdings
-

 apps2 weeks ago
Meet the Competing Apps Battling for Twitter’s Market Share
-
 Politics13 hours ago
How Do Chinese Citizens Feel About Other Countries?
-

 Markets4 weeks ago
Visualizing Every Company on the S&P 500 Index