Cities
Ranked: The Most Affordable U.S. Cities for Home Buyers

Ranked: The Most Affordable U.S. Cities for Home Buyers
Just before the pandemic, the average home price in the U.S. was $313,000—a figure that has since jumped by 40% to $436,800 today. As home prices and mortgage rates increase, home ownership is becoming an unrealistic dream for some.
In the cities ranked above, however, buying a house is a much more attainable goal.
By looking at factors like the real estate tax rate, median home price appreciation, and cost of living, this study from WalletHub assesses the most affordable cities in the U.S. for home buyers. The scores in the ranking are out of 100 and the higher a score, the more affordable that city is for home buyers.
The Methodology
This ranking considers much more than just the price tag on a house when it comes to affordability. Using 10 metrics, which cover an array of important considerations for home buyers, the overall affordability score is measured for each city.
Here’s a closer look at the 10 categories and how each one was weighted and measured:
| Metric | Weight |
|---|---|
| Housing Affordability | 25.00 points |
| Cost per Square Foot | 16.67 points |
| Maintenance Affordability | 8.33 points |
| Average Cost of Homeowner's Insurance | 8.33 points |
| Cost of Living | 8.33 points |
| Real Estate Tax Rate | 8.33 points |
| Rent-to-Price-Ratio | 8.33 points |
| Median Home Price Appreciation | 8.33 points |
| Quarterly Active Listings per Capita | 4.17 points |
| Vacancy Rate | 4.17 points |
The highest-weighted metric is the median price of the home itself divided by the median household income in that area, or house affordability.
Other important metrics assessed include the availability of homes for sale, the average cost of homeowner’s insurance, maintenance costs, and many other vital things people must consider when purchasing a home.
Which U.S. Cities are the Most Affordable for Home Buyers?
Here’s a closer look at the 50 most affordable cities for home buyers in the U.S.:
| Rank | City | Score |
|---|---|---|
| T1 | Montgomery, AL | 71.4 |
| T1 | Flint, MI | 71.4 |
| 3 | Toledo, OH | 71.0 |
| 4 | Detroit, MI | 70.9 |
| 5 | Akron, OH | 70.3 |
| 6 | Warren, MI | 70.2 |
| 7 | Pittsburgh, PA | 70.1 |
| 8 | Yuma, AZ | 69.5 |
| T9 | Springfield, Il | 69.1 |
| T9 | Palm Bay, FL | 69.1 |
| 11 | Augusta, GA | 68.9 |
| 12 | Surpise, AZ | 68.7 |
| 13 | Grand Rapids, MI | 68.5 |
| 14 | Davenport, IA | 68.3 |
| T15 | Buffalo, NY | 68.2 |
| T15 | Cedar Rapids, IA | 68.2 |
| 17 | Columbus, OH | 68.1 |
| 18 | North Las Vegas, NV | 67.9 |
| T19 | Fayetteville, NC | 67.8 |
| T19 | Des Moines, IA | 67.8 |
| 21 | Peoria, IL | 67.4 |
| T22 | Cleveland, OH | 67.2 |
| T22 | Las Vegas, NV | 67.2 |
| 24 | Livonia, MI | 67.0 |
| T25 | Dayton, OH | 66.9 |
| T25 | Erie, PA | 66.9 |
| 27 | Dearborn, MI | 66.5 |
| 28 | Columbus, GA | 66.4 |
| 29 | Lakeland, FL | 66.2 |
| 30 | Rockford, IL | 66.1 |
| 31 | Memphis, TN | 65.9 |
| 32 | Henderson, NV | 65.6 |
| T33 | Birmingham, AL | 65.5 |
| T33 | Louisville, KY | 65.5 |
| T33 | Fort Smith, AR | 65.5 |
| T33 | Gilbert, AZ | 65.5 |
| 37 | Peoria, AZ | 65.3 |
| 38 | Mesa, AZ | 65.2 |
| 39 | Chesapeake, VA | 65.0 |
| 40 | Green Bay, WI | 64.9 |
| 41 | High Point, NC | 64.5 |
| 42 | Baltimore, MD | 64.4 |
| 43 | Cape Coral, FL | 64.3 |
| 44 | Fort Wayne, IN | 64.1 |
| T45 | Indianapolis, IN | 63.9 |
| T45 | Joliet, IL | 63.9 |
| T45 | Tuscaloosa, AL | 63.9 |
| 48 | Philadelphia, PA | 63.8 |
| 49 | Lansing, MI | 63.7 |
| 50 | Chandler, AZ | 63.5 |
When it comes to the individual metrics, here’s a look at some cities which had the best scores in a few of the unique categories:
- #1 in Housing Affordability: Springfield, IL
- #1 in Maintenance Affordability: Sunnyvale, CA
- #1 in Rent-to-Price Ratio: Flint, MI
- #1 in Vacancy Rate: Miami Beach, FL
Location, Location, Location
Narrowing down which locations are feasible from a lifestyle and financial standpoint is a critical first step in the home-buying journey. Popular suburban communities and iconic hubs like Los Angeles or NYC hold great appeal, but these places command a higher price point or have housing stock that is incompatible with lifestyle needs.
On the flip side, some of the most affordable cities may have issues that negatively affect desirability. Flint, Michigan (#1), for example, is still widely perceived to have issues with its drinking water. Other places are high in crime or have a narrow range of economic opportunities, like Detroit (#4) or Yuma, Arizona (#9), respectively.
Many of the cities in the ranking are concentrated in Michigan, Arizona, and Ohio. In terms of big cities that are actually affordable, Pittsburgh, Columbus, Philadelphia, and Baltimore are examples of well-known spots to make the list.
There are also a number of ties in the ranking, with makes for interesting juxtapositions. For instance, Las Vegas is just as affordable as Cleveland, Ohio (#22). Here’s a look at some other cities that are equally affordable for home buyers:
- Montgomery, Alabama and Flint, Michigan (#1)
- Springfield, Illinois and Palm Bay, Florida (#9)
- Buffalo, New York and Cedar Rapids, Iowa (#15)
- Fayetteville, North Carolina and Des Moines, Iowa (#19)
- Dayton, Ohio and Erie, Pennsylvania (#25)
- Birmingham, Alabama; Louisville, Kentucky; Fort Smith, Arkansas; and Gilbert, Arizona (#33)
- Indianapolis, Indiana; Joliet, Illinois; and Tuscaloosa, Alabama (#45)
Overall, the home ownership rate in the U.S.—the share of homes that are occupied by their owners—is currently 66%, according to FRED data. While the trend shows a general recovery from the steep drop off that occurred during the pandemic, there is a while to go before the U.S. reaches pre-2020 figures. Perhaps, these affordable towns could offer a solution.
Where Does This Data Come From?
Source: WalletHub using data from the U.S. Census Bureau, The National Association of Realtors, Council for Community and Economic Research and Insurance Information Institute.
Data notes: To determine the most affordable cities for home buyers, WalletHub compared a sample of 300 U.S. cities (varying in size) across ten key metrics, which are listed below with their corresponding weights. Each metric was graded on a 100-point scale, with a score of 100 representing the most favorable conditions for home affordability. The ranking only considers proper cities and not surrounding metropolitan areas. Visit the source for further details.


Maps
Mapped: The Safest Cities in the U.S.
How safe is small town America? This map reveals the safest cities in the U.S. in terms of the total crime rate per every 1,000 residents.
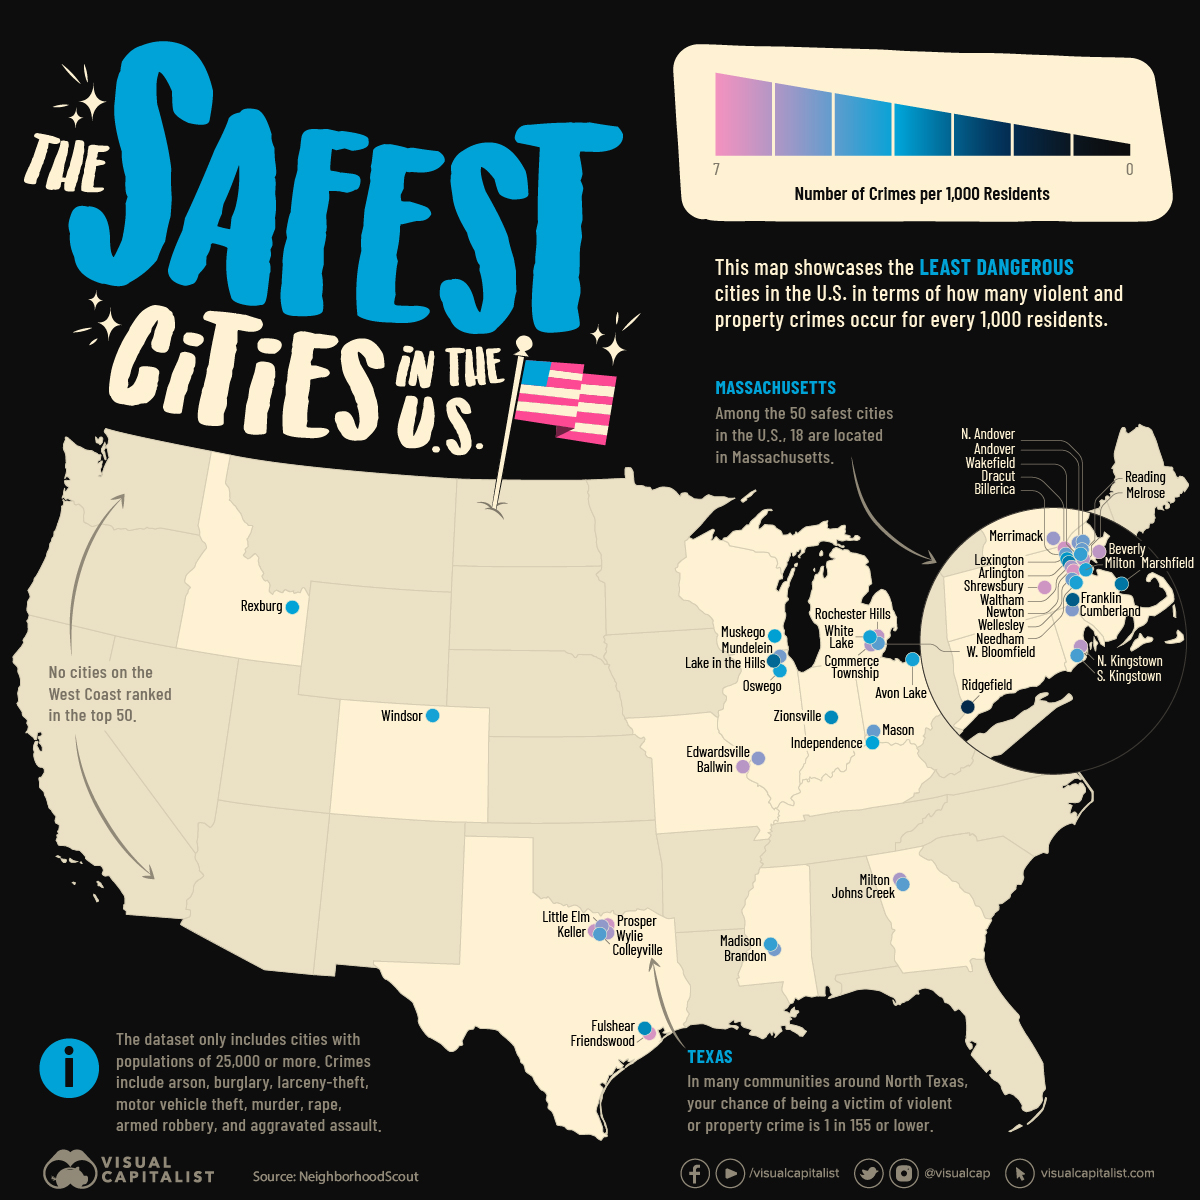
Mapped: The Safest Cities in America
The phrase “small town America” often conjures up images of white picket fences, well-trimmed lawns, and big houses. But how safe is modern-day suburbia in America?
Some of the smallest places in the country can actually be among the most dangerous. Take for example Bessemer, Alabama, with a population of around 26,000 and a violent crime rate of 33.1 per every 1,000 residents.
That said, there are many small cities that are true havens for families across the United States. This map showcases the safest cities in the U.S., using FBI data and Census Bureau populations compiled by NeighborhoodScout in 2023.
Note: The source only considered cities with a population of 25,000 or higher. This report is based on total index crimes reported in each city, which includes arson, burglary, larceny-theft, motor vehicle theft, murder, rape, armed robbery, and aggravated assault.
Top 100 Safest Cities in the U.S.
40% of the cities in the ranking are located in Northeastern states, which are typically rated the “safest” based on FBI data.
Here’s a closer look at the full list:
| Rank | City | State | Total Crime Rate(per 1,000 residents) | Chance of Beinga Victim |
|---|---|---|---|---|
| 1 | Ridgefield | Connecticut | 1.9 | 1 in 510 |
| 2 | Franklin | Massachusetts | 2.9 | 1 in 344 |
| 3 | Lake in the Hills | Illinois | 3.1 | 1 in 321 |
| 4 | Marshfield | Massachusetts | 3.3 | 1 in 300 |
| 5 | Arlington | Massachusetts | 3.4 | 1 in 292 |
| 6 | Fulshear | Texas | 3.6 | 1 in 276 |
| 7 | Zionsville | Indiana | 3.6 | 1 in 275 |
| 8 | Lexington | Massachusetts | 3.7 | 1 in 270 |
| 9 | Muskego | Wisconsin | 3.8 | 1 in 265 |
| 10 | Rexburg | Idaho | 3.9 | 1 in 253 |
| 11 | Independence | Kentucky | 3.9 | 1 in 253 |
| 12 | Oswego | Illinois | 4.1 | 1 in 238 |
| 13 | Milton | Massachusetts | 4.2 | 1 in 233 |
| 14 | Needham | Massachusetts | 4.2 | 1 in 233 |
| 15 | White Lake | Michigan | 4.2 | 1 in 233 |
| 16 | Avon Lake | Ohio | 4.3 | 1 in 232 |
| 17 | Madison | Mississippi | 4.5 | 1 in 221 |
| 18 | Wakefield | Massachusetts | 4.5 | 1 in 218 |
| 19 | Windsor | Colorado | 4.5 | 1 in 218 |
| 20 | South Kingstown | Rhode Island | 4.7 | 1 in 212 |
| 21 | Colleyville | Texas | 4.8 | 1 in 206 |
| 22 | West Bloomfield | Michigan | 4.9 | 1 in 204 |
| 23 | Johns Creek | Georgia | 4.9 | 1 in 202 |
| 24 | Billerica | Massachusetts | 5.1 | 1 in 195 |
| 25 | Mason | Ohio | 5.1 | 1 in 192 |
| 26 | Reading | Massachusetts | 5.1 | 1 in 192 |
| 27 | North Andover | Massachusetts | 5.2 | 1 in 190 |
| 28 | Wellesley | Massachusetts | 5.2 | 1 in 189 |
| 29 | Mundelein | Illinois | 5.3 | 1 in 187 |
| 30 | Brandon | Mississippi | 5.3 | 1 in 186 |
| 31 | Cumberland | Rhode Island | 5.4 | 1 in 184 |
| 32 | Andover | Massachusetts | 5.4 | 1 in 182 |
| 33 | Edwardsville | Illinois | 5.5 | 1 in 178 |
| 34 | Little Elm | Texas | 5.6 | 1 in 176 |
| 35 | Merrimack | New Hampshire | 5.7 | 1 in 172 |
| 36 | Waltham | Massachusetts | 5.8 | 1 in 169 |
| 37 | Wylie | Texas | 5.9 | 1 in 169 |
| 38 | Commerce Township | Michigan | 5.9 | 1 in 169 |
| 39 | Milton | Georgia | 5.9 | 1 in 167 |
| 40 | Melrose | Massachusetts | 6.0 | 1 in 164 |
| 41 | Ballwin | Missouri | 6.1 | 1 in 162 |
| 42 | North Kingstown | Rhode Island | 6.1 | 1 in 162 |
| 43 | Beverly | Massachusetts | 6.2 | 1 in 161 |
| 44 | Rochester Hills | Michigan | 6.2 | 1 in 160 |
| 45 | Keller | Texas | 6.3 | 1 in 158 |
| 46 | Shrewsbury | Massachusetts | 6.4 | 1 in 156 |
| 47 | Dracut | Massachusetts | 6.4 | 1 in 155 |
| 48 | Prosper | Texas | 6.4 | 1 in 155 |
| 49 | Newton | Massachusetts | 6.5 | 1 in 152 |
| 50 | Friendswood | Texas | 6.5 | 1 in 152 |
| 51 | McHenry | Illinois | 6.5 | 1 in 152 |
| 52 | Fort Mill | South Carolina | 6.6 | 1 in 151 |
| 53 | Wallingford | Connecticut | 6.8 | 1 in 146 |
| 54 | Caledonia | Wisconsin | 6.9 | 1 in 144 |
| 55 | Belmont | Massachusetts | 6.9 | 1 in 144 |
| 56 | De Pere | Wisconsin | 6.9 | 1 in 143 |
| 57 | Flower Mound | Texas | 7.0 | 1 in 142 |
| 58 | Easton | Massachusetts | 7.0 | 1 in 141 |
| 59 | Highland Park | Illinois | 7.0 | 1 in 141 |
| 60 | Carmel | Indiana | 7.2 | 1 in 138 |
| 61 | Sachse | Texas | 7.2 | 1 in 138 |
| 62 | Algonquin | Illinois | 7.2 | 1 in 137 |
| 63 | Hendersonville | Tennessee | 7.2 | 1 in 137 |
| 64 | San Luis | Arizona | 7.3 | 1 in 136 |
| 65 | Fishers | Indiana | 7.3 | 1 in 135 |
| 66 | Perrysburg | Ohio | 7.4 | 1 in 135 |
| 67 | Lake Stevens | Washington | 7.4 | 1 in 134 |
| 68 | Cheshire | Connecticut | 7.4 | 1 in 134 |
| 69 | Milford | Massachusetts | 7.5 | 1 in 132 |
| 70 | Saratoga Springs | Utah | 7.5 | 1 in 132 |
| 71 | Bella Vista | Arkansas | 7.5 | 1 in 132 |
| 72 | Princeton | New Jersey | 7.5 | 1 in 131 |
| 73 | Bluffton | South Carolina | 7.6 | 1 in 130 |
| 74 | Novi | Michigan | 7.6 | 1 in 130 |
| 75 | Chelmsford | Massachusetts | 7.6 | 1 in 130 |
| 76 | Amherst | Massachusetts | 7.7 | 1 in 129 |
| 77 | Rosemount | Minnesota | 7.7 | 1 in 129 |
| 78 | Gloucester | Massachusetts | 7.7 | 1 in 129 |
| 79 | Syracuse | Utah | 7.8 | 1 in 127 |
| 80 | Waukee | Iowa | 7.8 | 1 in 126 |
| 81 | Mequon | Wisconsin | 7.9 | 1 in 126 |
| 82 | Westfield | Indiana | 7.9 | 1 in 126 |
| 83 | Spring Hill | Tennessee | 7.9 | 1 in 126 |
| 84 | Upper Arlington | Ohio | 7.9 | 1 in 126 |
| 85 | Rahway | New Jersey | 7.9 | 1 in 125 |
| 86 | Montclair | New Jersey | 7.9 | 1 in 125 |
| 87 | Greenwich | Connecticut | 8.0 | 1 in 125 |
| 88 | Hutto | Texas | 8.0 | 1 in 124 |
| 89 | Vestavia Hills | Alabama | 8.0 | 1 in 123 |
| 90 | Brownsburg | Indiana | 8.1 | 1 in 123 |
| 91 | Wilmette | Illinois | 8.1 | 1 in 123 |
| 92 | New Milford | Connecticut | 8.1 | 1 in 122 |
| 93 | Hilliard | Ohio | 8.2 | 1 in 120 |
| 94 | Royal Oak | Michigan | 8.2 | 1 in 120 |
| 95 | Derry | New Hampshire | 8.3 | 1 in 121 |
| 96 | Dublin | Ohio | 8.3 | 1 in 120 |
| 97 | West Warwick | Rhode Island | 8.5 | 1 in 116 |
| 98 | Watertown | Massachusetts | 8.5 | 1 in 116 |
| 99 | Walpole | Massachusetts | 8.6 | 1 in 115 |
| 100 | Kaysville | Utah | 8.6 | 1 in 115 |
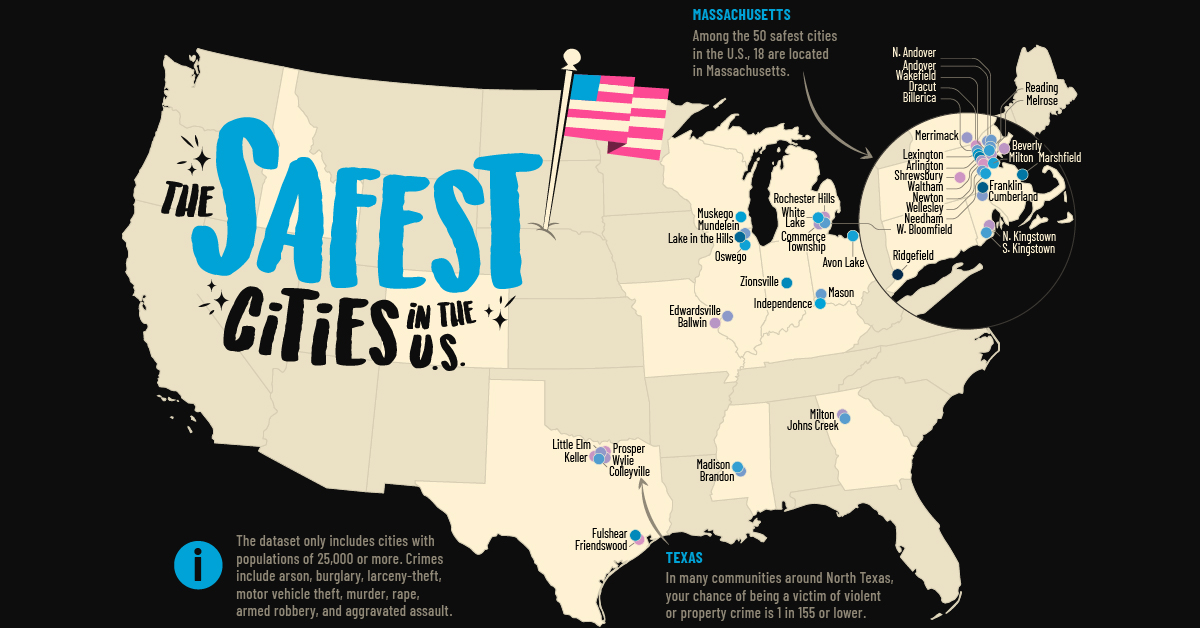
One quarter of the safest cities are located in Massachusetts, with the vast majority clustered around Boston.
The median population of the cities and towns in the top 100 is just 32,000, and few widely-recognized cities make the list. Carmel, Indiana (#60) is the only city with a population above 100,000 to make the rankings. This would seem to follow the logic that bigger cities are more dangerous, but our map covering the most dangerous cities in America shows that many small cities were just as dangerous, and some even more.
Regardless, small towns can truly be idyllic. For example, a person’s chance of falling victim to crime in Ridgefield, Connecticut, the safest ranked city in the U.S., is just 1-in-510. That’s an overall rate of fewer than two incidents of crime per every 1,000 residents.
One surprising observation from the data is that many of the safest U.S. cities are in very close proximity to some of the most dangerous.
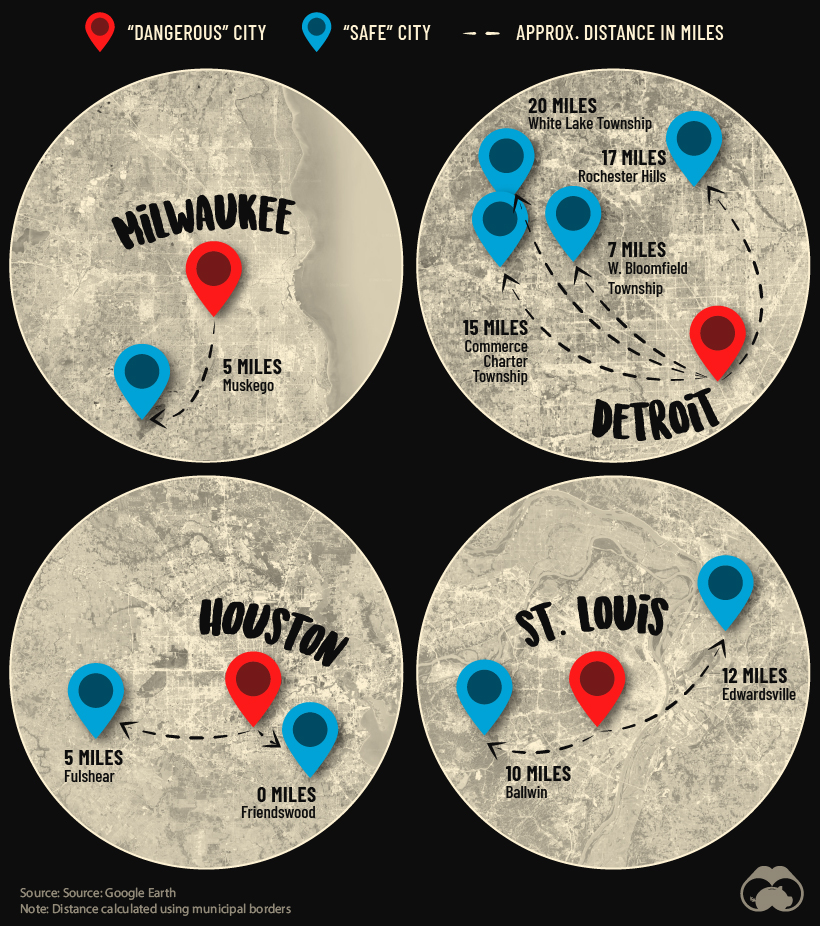
One example that illustrates this is Detroit, which ranks as the sixth most dangerous city in America. Despite this, as shown on the map above, there are four communities nearby that have some of the lowest crime rates in America.
In other words, America’s metro areas contain much contrast, and these insights provide valuable information for individuals and families seeking secure places to live across the country.

-
 Markets2 weeks ago
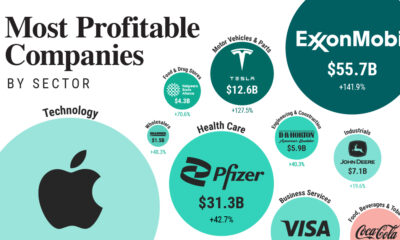
Ranked: The Most Profitable U.S. Companies, by Sector
-

 Technology5 days ago
How Long it Took for Popular Apps to Reach 100 Million Users
-
 Markets4 weeks ago
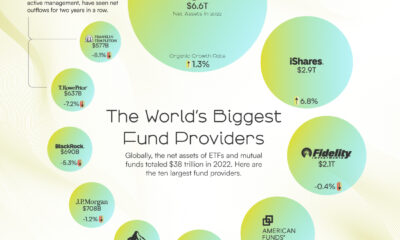
The World’s Biggest Mutual Fund and ETF Providers
-

 Brands2 weeks ago
Brand Reputations: Ranking the Best and Worst in 2023
-
 Environment5 days ago
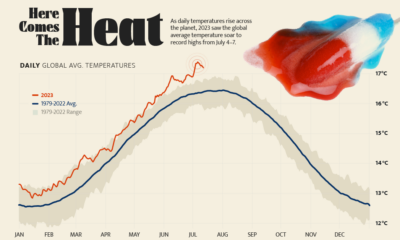
Hotter Than Ever: 2023 Sets New Global Temperature Records
-

 Datastream4 weeks ago
Can You Calculate Your Daily Carbon Footprint?
-
 Energy2 weeks ago
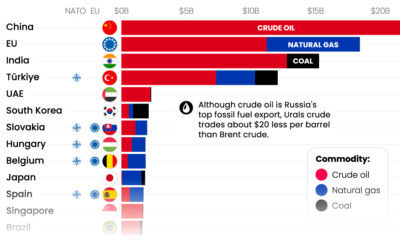
Who’s Still Buying Russian Fossil Fuels in 2023?
-

 VC+5 days ago
What’s New on VC+ in July