Investor Education
Visualizing BlackRock’s Top Equity Holdings
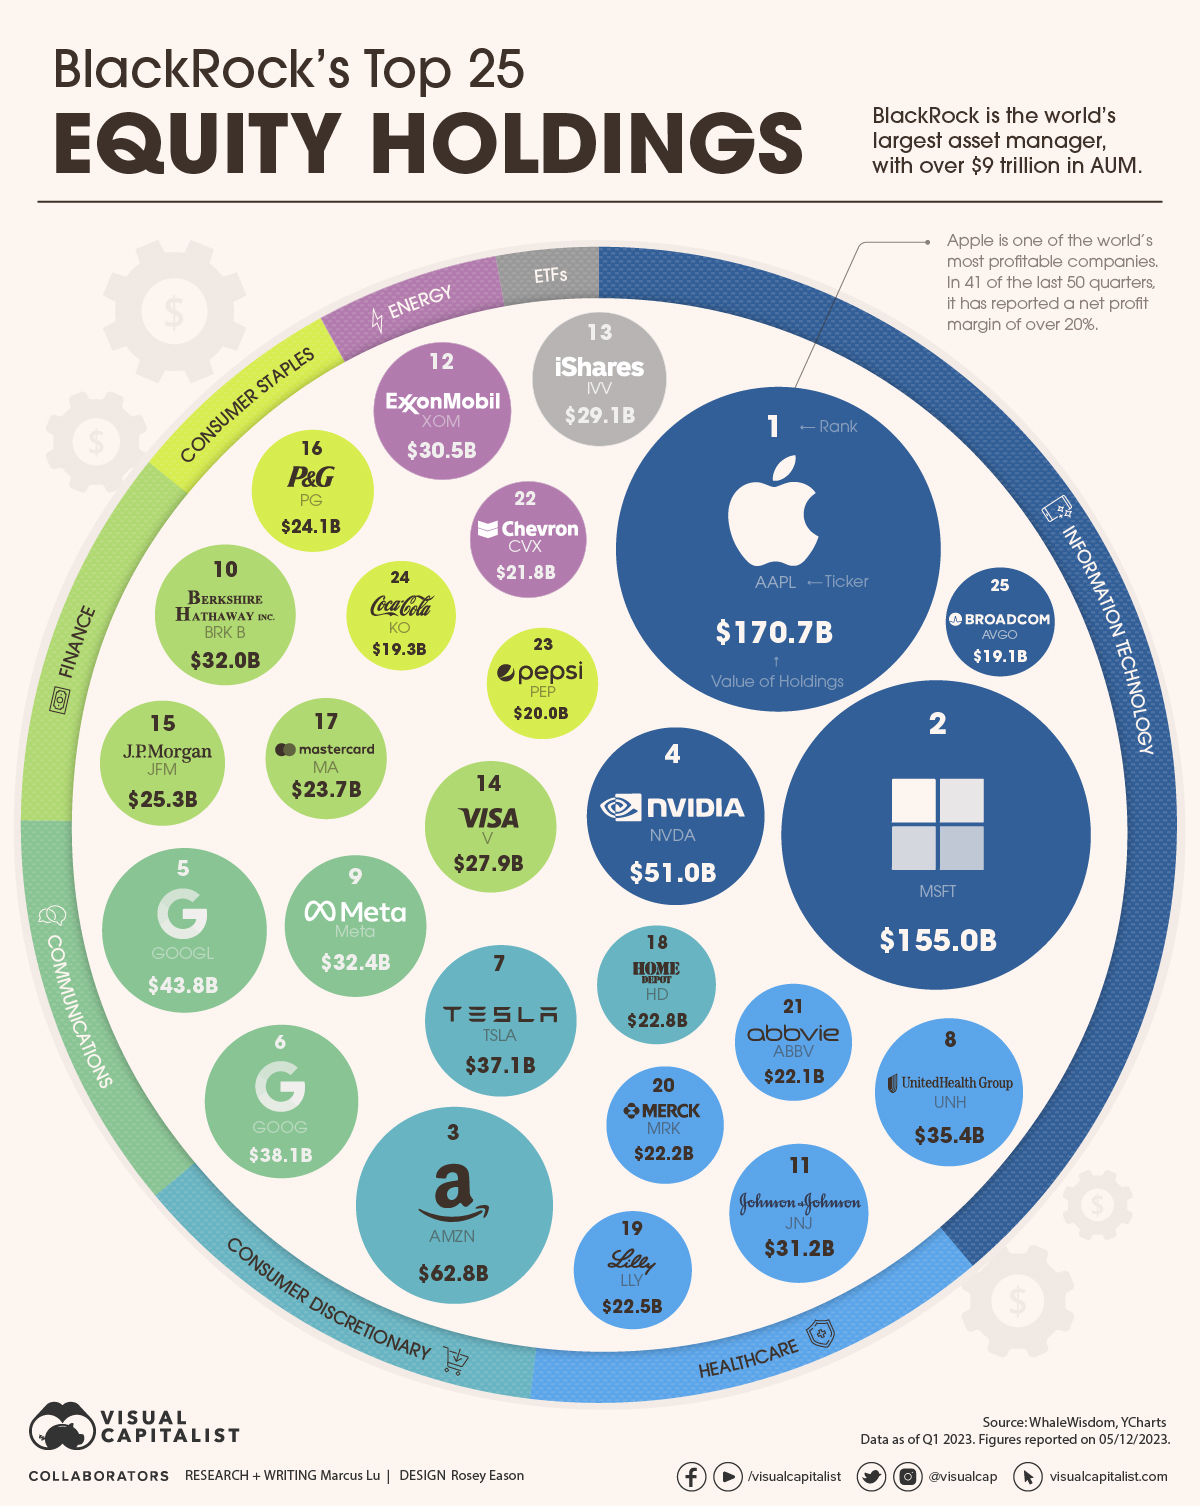
Visualizing BlackRock’s Top 25 Equity Holdings
Founded just 34 years ago in 1988, BlackRock has quickly become the world’s largest asset manager with over $9 trillion in assets under management (AUM).
Given this status, BlackRock’s equity portfolio may provide useful insights to investors. To learn more, we’ve visualized the firm’s top 25 equity holdings as of Q1 2023. At that time, these 25 positions were worth over $1 trillion, and they represented about 30% of BlackRock’s overall equity portfolio.
Top 25 Data
The following table shows the data we used to create this infographic. These figures come from BlackRock’s latest 13F filing, which was released on May 12.
| Rank | Name | Sector | Value of Holdings (USD billions) |
|---|---|---|---|
| 1 | Apple | Information Technology | $171 |
| 2 | Microsoft | Information Technology | $155 |
| 3 | Amazon | Consumer Discretionary | $63 |
| 4 | Nvidia | Information Technology | $51 |
| 5 | Google (Class A) | Communications | $44 |
| 6 | Google (Class C) | Communications | $38 |
| 7 | Tesla | Consumer Discretionary | $37 |
| 8 | UnitedHealth Group | Health Care | $35 |
| 9 | Meta | Communications | $32 |
| 10 | Berkshire Hathaway (Class B) | Finance | $32 |
| 11 | Johnson & Johnson | Health Care | $31 |
| 12 | Exxon Mobil | Energy | $30 |
| 13 | iShares Core S&P 500 ETF | ETF | $29 |
| 14 | Visa | Finance | $28 |
| 15 | JPMorgan Chase & Co | Finance | $25 |
| 16 | Procter & Gamble Co | Consumer Staples | $24 |
| 17 | Mastercard | Finance | $24 |
| 18 | Home Depot | Consumer Discretionary | $23 |
| 19 | Eli Lilly And Co | Health Care | $23 |
| 20 | Merck & Co | Health Care | $22 |
| 21 | AbbVie | Health Care | $22 |
| 22 | Chevron | Energy | $22 |
| 23 | PepsiCo | Consumer Staples | $20 |
| 24 | Coca-Cola Co | Consumer Staples | $19 |
| 25 | Broadcom | Information Technology | $19 |
As expected, BlackRock’s top equity holdings include America’s most established tech companies: Apple, Microsoft, Amazon, and Google.
BlackRock also has large positions in Nvidia and Broadcom, which happen to be America’s two largest semiconductor companies. Given Nvidia’s incredible YTD performance (198% as of June 19th), this position has likely grown even bigger.
Altogether, tech stocks make up 39% of this top 25 list. The next biggest sector would be healthcare, at 13% of the total value.
Ownership Stakes
How much of a controlling stake does BlackRock have in these companies? We answer this question in the following table, which again uses Q1 2023 data.
| Name | % Ownership | Quarter 1st Owned |
|---|---|---|
| Merck & Co | 8.24% | Q3 2007 |
| UnitedHealth Group | 8.02% | Q4 2008 |
| Berkshire Hathaway (Class B) | 7.98% | Q3 2007 |
| PepsiCo | 7.96% | Q3 2007 |
| AbbVie | 7.86% | Q1 2013 |
| Home Depot | 7.60% | Q3 2007 |
| Nvidia | 7.44% | Q3 2007 |
| Microsoft | 7.22% | Q3 2007 |
| Coca-Cola Co | 7.20% | Q3 2007 |
| Broadcom | 7.16% | Q3 2009 |
| Google (Class A) | 7.09% | Q3 2007 |
| Chevron | 7.02% | Q3 2007 |
| Eli Lilly And Co | 6.90% | Q3 2007 |
| Mastercard | 6.89% | Q3 2007 |
| Procter & Gamble Co | 6.86% | Q3 2007 |
| Exxon Mobil | 6.83% | Q3 2007 |
| JPMorgan Chase & Co | 6.59% | Q3 2007 |
| Visa | 6.55% | Q2 2008 |
| Apple | 6.54% | Q3 2007 |
| Johnson & Johnson | 6.46% | Q3 2007 |
| Google (Class C) | 6.13% | Q2 2014 |
| Amazon | 5.93% | Q4 2008 |
| Tesla | 5.70% | Q3 2010 |
| Meta | 5.69% | Q2 2012 |
Google’s Class C shares (Ticker: GOOG) do not offer voting rights.
When it comes to shareholder voting, BlackRock has historically voted on behalf of its clients to “advance their long-term economic interests.” Given its massive size, some people believe that BlackRock has too much influence on major corporations.
In 2021, it was reported that BlackRock would begin allowing some institutional clients to cast their own votes at shareholder meetings.


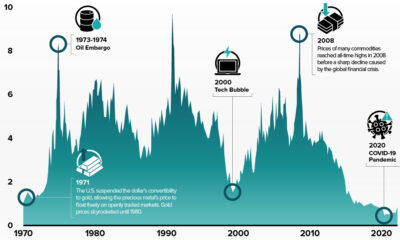


Markets
10-Year Annualized Forecasts for Major Asset Classes
This infographic visualizes 10-year annualized forecasts for both equities and fixed income using data from Vanguard.

10-Year Annualized Forecasts for Major Asset Classes
While there’s no way of predicting the future, quantitative models can help us come up with a general idea of how different asset classes may perform in the future.
One example is Vanguard’s Capital Markets Model (VCMM), which has produced a set of 10-year annualized return forecasts for both equity and fixed income markets.
Visualized above, these projections were published on May 17, 2023, and are based on the March 31, 2023 running of the VCMM.
Equity Returns
The equity forecasts from this infographic are listed in the following table.
| Asset Class | Return Forecast (lower) | Return Forecast (upper) | Median Volatility |
|---|---|---|---|
| U.S. Equities | 4.1% | 6.1% | 17.0% |
| U.S. Value | 4.4% | 6.4% | 19.6% |
| U.S. Growth | 1.4% | 3.4% | 18.2% |
| U.S. Large-Cap | 4.1% | 6.1% | 16.7% |
| U.S. Small-Cap | 4.4% | 6.4% | 22.3% |
| U.S. Real Estate Investment Trusts | 4.4% | 6.4% | 20.1% |
| Global Equities ex-U.S. (unhedged) | 6.4% | 8.4% | 18.2% |
| Global ex-U.S. Developed Markets Equities (unhedged) | 6.1% | 8.1% | 16.6% |
| Emerging Markets Equities (unhedged) | 6.1% | 8.1% | 25.9% |
A key takeaway here is that Vanguard expects international equities to outperform U.S. equities over the next decade.
We believe that the valuation-based expansion in U.S. equities is sowing the seeds for lower returns in the decade.
A valuation-based expansion refers to the increase in a company’s market value, rather than its intrinsic value. In other words, Vanguard doesn’t believe that current U.S. equity valuations are justified, and that this will dampen performance over the next decade.
Cited reasons for international outperformance include more favorable valuations, higher dividend payout ratios, and a potentially weaker U.S. dollar.
Fixed Income Returns
Now turning to fixed income, here are the forecasts used in this infographic.
| Asset Class | Return Forecast (lower) | Return Forecast (upper) | Median Volatility |
|---|---|---|---|
| U.S. Aggregate Bonds | 3.6% | 4.6% | 5.5% |
| U.S. Treasury Bonds | 3.3% | 4.3% | 5.7% |
| U.S. Intermediate Credit Bonds | 4.2% | 5.2% | 5.2% |
| U.S. High-Yield Corporate Bonds | 5.5% | 6.5% | 10.1% |
| U.S. Treasury Inflation-Protected Securities | 2.7% | 3.7% | 5.0% |
| U.S. Cash | 3.4% | 4.4% | 1.4% |
| Global Bonds ex-U.S. (hedged) | 3.6% | 4.6% | 4.4% |
| Emerging Markets Sovereign Bonds | 5.6% | 6.6% | 10.9% |
| U.S. Inflation | 2.0% | 3.0% | 2.3% |
Several bond indexes saw record-breaking declines in 2022 thanks to the unprecedented speed of interest rate hikes. Despite this turmoil, Vanguard believes that investors with a longer horizon will actually be better off as a result. The reasoning here is that cash flows can now be reinvested at much higher rates, which over time should offset any declines in an investor’s bond portfolio.
Vanguard also expects U.S. inflation to be contained over the next decade. The firm has confidence in the ability of central banks to keep inflation at their target rates (2% in most developed economies).

-
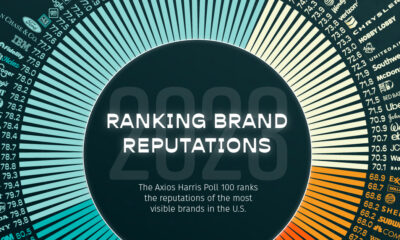
 Brands2 weeks ago
Brand Reputations: Ranking the Best and Worst in 2023
-
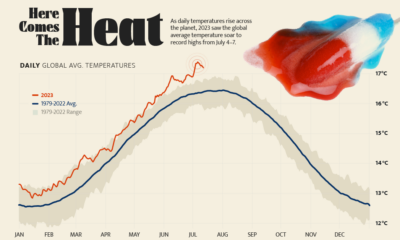
 Green5 days ago
Hotter Than Ever: 2023 Sets New Global Temperature Records
-
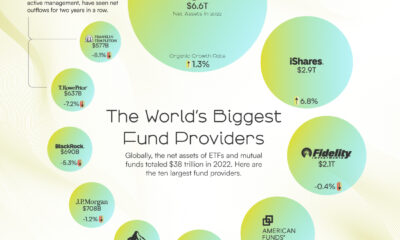
 Markets4 weeks ago
The World’s Biggest Mutual Fund and ETF Providers
-
 Energy2 weeks ago
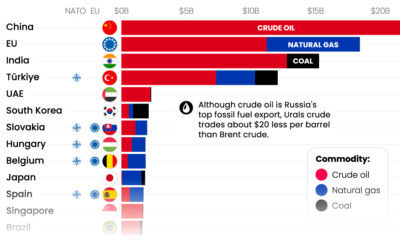
Who’s Still Buying Russian Fossil Fuels in 2023?
-

 VC+4 days ago
What’s New on VC+ in July
-

 Datastream4 weeks ago
Can You Calculate Your Daily Carbon Footprint?
-

 Technology2 weeks ago
Meet the Competing Apps Battling for Twitter’s Market Share
-
 China17 hours ago
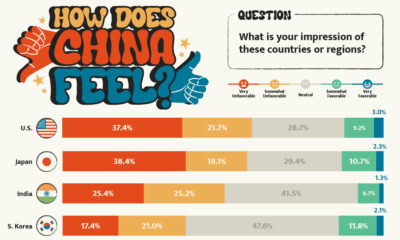
How Do Chinese Citizens Feel About Other Countries?