Markets
Visualizing 1 Billion Square Feet of Empty Office Space
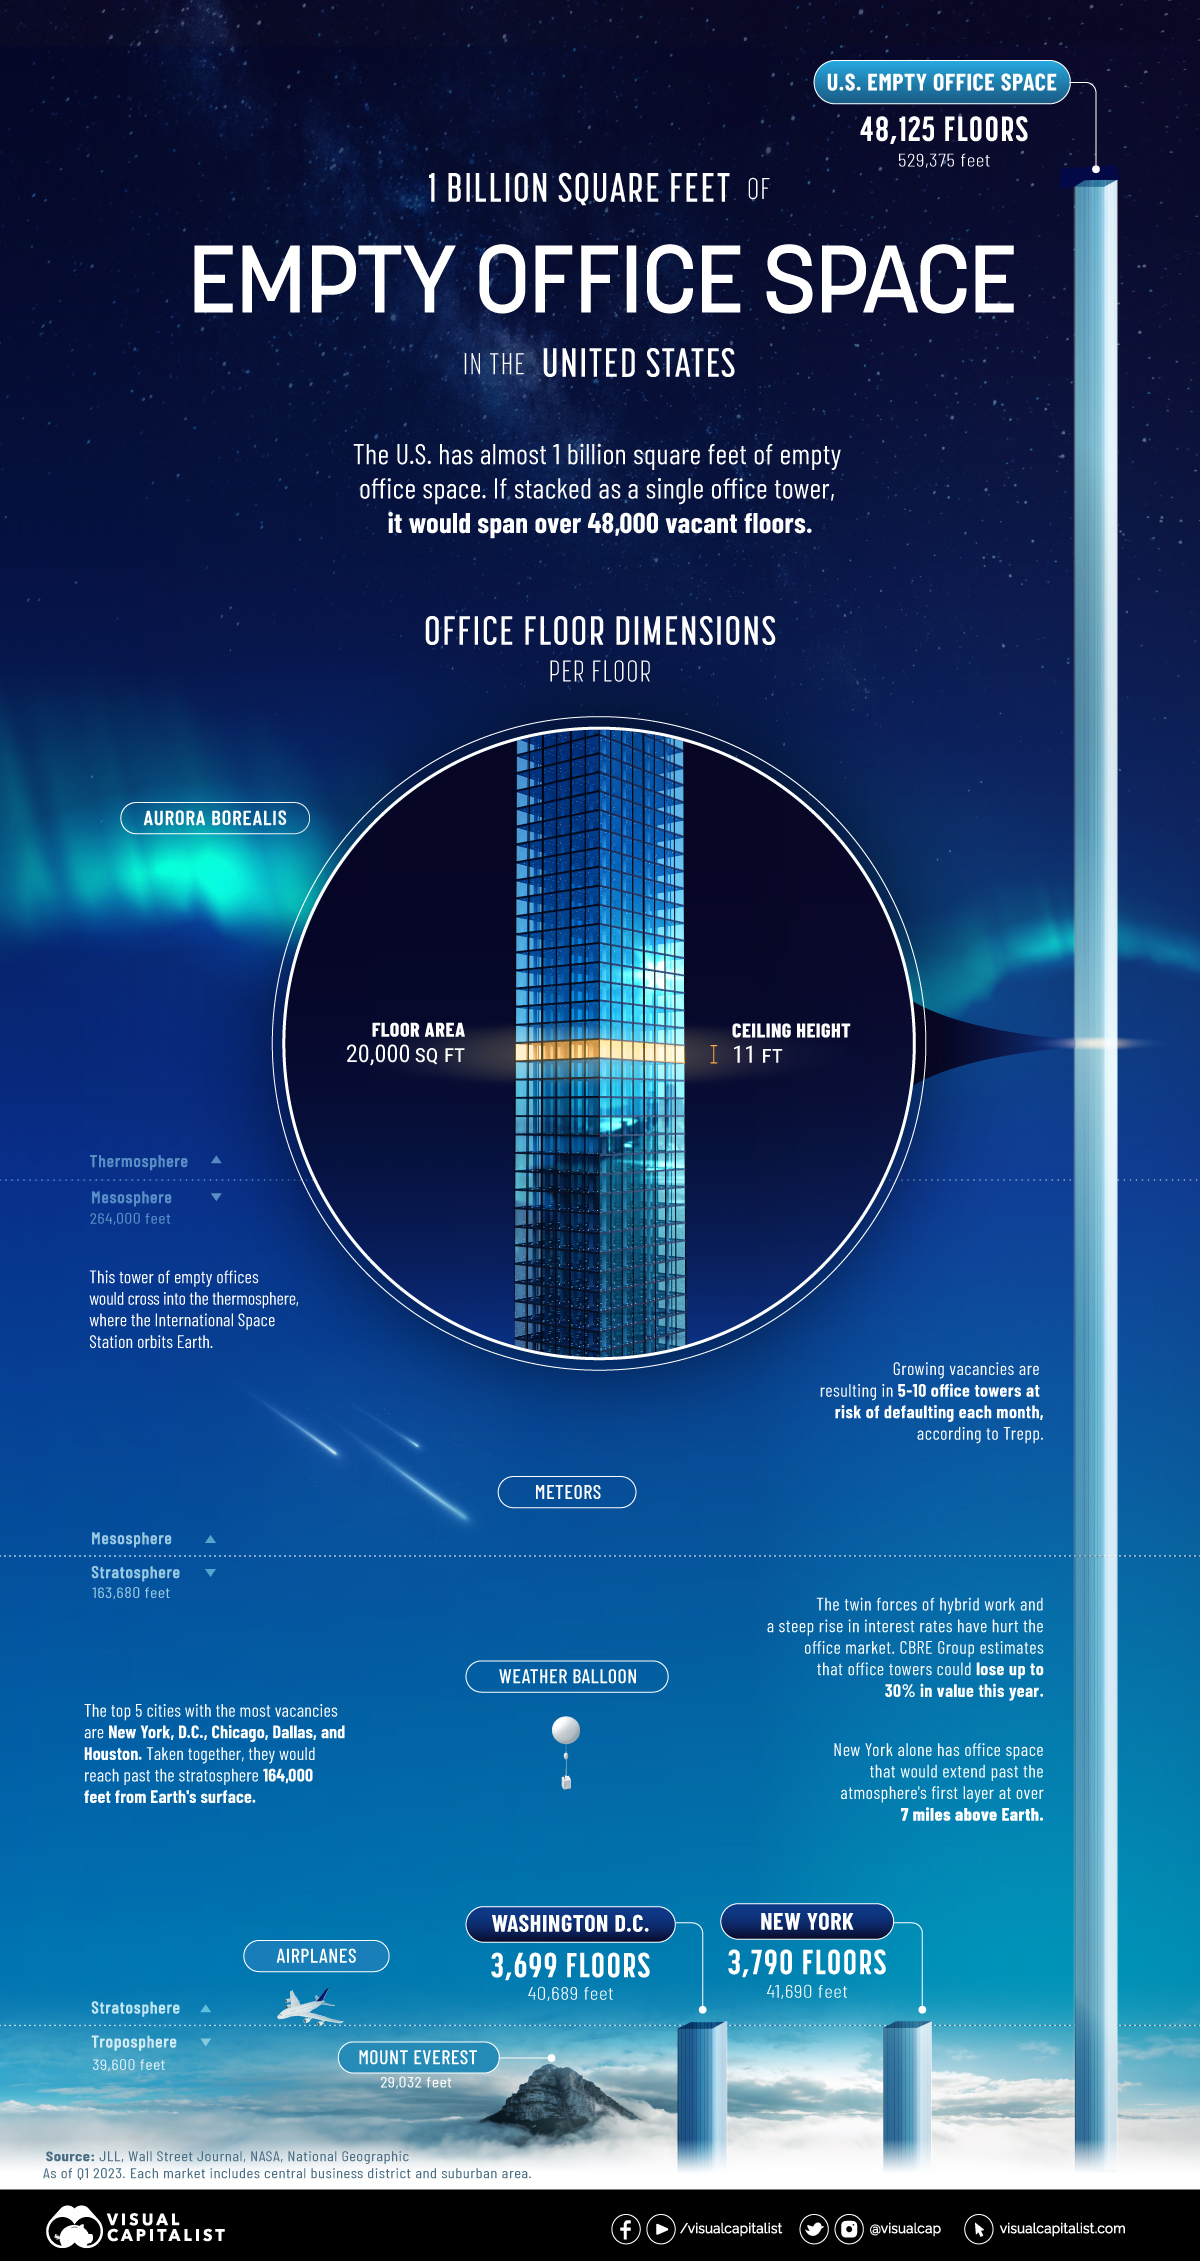
1 Billion Square Feet of Empty Office Space
In April, one of America’s largest office owners, Brookfield, defaulted on a $161 million loan.
The loan, covering 12 office buildings, was mainly concentrated in the Washington, D.C. market. Faced with low occupancy rates, it joined other office giants Blackstone and WeWork defaulting on office debt this year.
The above graphic shows nearly 1 billion square feet of empty office space in the U.S. based on data from JLL—and the wider implications of office towers standing empty.
Ranking U.S. Cities by Empty Office Space
At the end of the first quarter of 2023, a record 963 million square feet of office space was unoccupied in America. An estimated five to 10 office towers are at risk of defaulting each month according to Manus Clancy, senior managing director at Trepp.
Here are cities ranked by their total square feet of office vacancy as of Q1 2023. Figures include central business districts and suburban areas.
| Ranking | Market | Total Vacancy (SF) | Total Vacancy (%) |
|---|---|---|---|
| 1 | New York | 75.8M | 16.1% |
| 2 | Washington, D.C. | 74.0M | 20.8% |
| 3 | Chicago | 63.2M | 23.5% |
| 4 | Dallas | 53.5M | 25.0% |
| 5 | Houston | 49.3M | 25.6% |
| 6 | Los Angeles | 47.1M | 24.1% |
| 7 | New Jersey | 43.3M | 25.8% |
| 8 | Atlanta | 38.1M | 21.6% |
| 9 | Boston | 31.8M | 19.1% |
| 10 | Philadelphia | 27.8M | 18.8% |
| 11 | Denver | 27.3M | 21.6% |
| 12 | Phoenix | 25.2M | 23.9% |
| 13 | San Francisco | 22.8M | 26.4% |
| 14 | Seattle | 21.4M | 17.7% |
| 15 | Minneapolis | 19.9M | 19.7% |
| 16 | Detroit | 18.0M | 19.3% |
| 17 | Orange County | 17.7M | 17.6% |
| 18 | Salt Lake City | 13.9M | 18.5% |
| 19 | Kansas City | 13.8M | 20.8% |
| 20 | Pittsburgh | 13.8M | 21.8% |
| 21 | Charlotte | 13.7M | 20.6% |
| 22 | Austin | 13.6M | 18.9% |
| 23 | Baltimore | 13.1M | 18.2% |
| 24 | Portland | 12.8M | 17.5% |
| 25 | Silicon Valley | 12.1M | 17.3% |
| 26 | Oakland–East Bay | 11.7M | 22.0% |
| 27 | San Diego | 10.7M | 12.3% |
| 28 | St. Louis | 10.5M | 21.9% |
| 29 | Cincinnati | 10.1M | 21.4% |
| 30 | Sacramento | 9.9M | 19.6% |
| 31 | Fairfield County | 9.7M | 25.4% |
| 32 | Columbus | 9.7M | 21.7% |
| 33 | Milwaukee | 9.2M | 24.0% |
| 34 | Nashville | 9.0M | 18.9% |
| 35 | Raleigh-Durham | 8.9M | 15.2% |
| 36 | Indianapolis | 8.6M | 22.4% |
| 37 | Tampa | 8.2M | 17.2% |
| 38 | Fort Worth | 7.6M | 16.7% |
| 39 | Miami | 7.6M | 16.2% |
| 40 | Cleveland | 7.3M | 18.3% |
| 41 | San Antonio | 7.2M | 17.8% |
| 42 | Long Island | 6.3M | 15.2% |
| 43 | Westchester County | 5.8M | 22.1% |
| 44 | Jacksonville | 5.4M | 18.6% |
| 45 | Orlando | 5.0M | 13.3% |
| 46 | San Francisco Peninsula | 4.4M | 13.3% |
| 47 | Richmond | 4.3M | 13.3% |
| 48 | Fort Lauderdale | 4.3M | 16.1% |
| 49 | North San Francisco Bay | 4.0M | 18.3% |
| 50 | Louisville | 3.6M | 16.8% |
| 51 | Des Moines | 3.2M | 12.0% |
| 52 | Hampton Roads | 3.1M | 14.7% |
| 53 | West Palm Beach | 2.4M | 10.3% |
| 54 | Grand Rapids | 1.8M | 13.2% |
| United States | 962.5M | 20.2% |
Numbers may not total 100 due to rounding.
New York has roughly 76 million square feet of empty office space. If this were stacked as a single office building, it would stretch 7 miles into the atmosphere. In 2019, the office sector accounted for about a third of all jobs in the city.
Falling closely behind is Washington, D.C. with a 21% vacancy rate—8% higher than what is typically considered healthy. Occupiers are downsizing given remote work trends, yet some office buildings are being converted to residential properties, curtailing vacancy rates.
Across 54 markets in the dataset, San Francisco has the highest vacancy rate at over 26%. Prior to the pandemic, vacancy rates were about 4%. This year, Salesforce walked away from a 30-story tower in downtown San Francisco spanning 104,000 square feet in an effort to cut costs.
Overall, rising interest rates and higher vacancies have hurt U.S. office markets, with many cities potentially seeing an uptick in vacancies going forward.
Empty Office Space: Impact on Banks
Office building valuations are projected to fall 30% in 2023 according to Richard Barkham, global chief economist at CBRE Group.
A sharp decline in property values could potentially result in steep losses for banks. This is especially true for small and regional banks that make up the majority of U.S. office loans. Big banks cover roughly 20% of office and downtown retail totals.
Consider how commercial real estate exposure breaks down by different types of banks:
| Bank Assets | Commercial Real Estate Loans % of Total Assets | Share of Industry Assets |
|---|---|---|
| <$100M | 11.3% | 0.2% |
| $100M-$1B | 26.9% | 4.7% |
| $1B-$10B | 32.5% | 9.7% |
| $10B-$250B | 18.1% | 30.1% |
| >$250B | 5.6% | 55.5% |
Source: FitchRatings
For big banks, a recent stress test by the Federal Reserve shows that a 40% decline in commercial property values could result in a $65 billion loss on their commercial loan portfolios. The good news is that many big banks are sitting on healthy capital reserves based on requirements set in place after the global financial crisis.
Smaller banks are a different story. Many have higher loan concentrations and less oversight on reserve requirements. If these loan portfolios deteriorate, banks may face a downgrade in ratings and higher credit losses.
Additionally, banks with loans in markets with high vacancy rates like San Francisco, Houston, and Washington, D.C. could see more elevated risk.
How High Rates Could Escalate Losses
Adding further strain are the ramifications of higher interest rates.
Higher rates have negatively impacted smaller banks’ balance sheets—meaning they are less likely to issue new loans. This is projected to cause commercial real estate transaction volume to decline 27% in 2023, contributing to lower prices. Banks have already slowed lending for commercial real estate in 2023 due to credit quality concerns.
The good news is that some banks are extending existing loan terms or restructuring debt. In this way, banks are willing to negotiate new loan agreements to prevent widespread foreclosures from hurting their commercial loan portfolios. Short-term extensions on existing loans were often seen during the global financial crisis.
Still, foreclosures could take place if restructuring the loan doesn’t make financial sense.
Overall, only so many banks may be willing to wait out the uncertainty with loan extensions if fundamentals continue to worsen. Offices that are positioned to weather declines will likely have better quality, location, roster of tenants, and financing structures.


Stocks
The 50 Best One-Year Returns on the S&P 500 (1980-2022)
The highest one-year return among the top S&P 500 stocks from 1980 to 2022 was a staggering 2,620%. Which stocks top the ranks?
The Top S&P 500 Stocks by Annual Returns
The average annual return of the S&P 500 was 10% from 1980-2022, excluding dividends. Of course, there are some companies that deliver much higher returns in any given year.
In this graphic using data from S&P Dow Jones Indices, we explore the top S&P 500 stocks with the best single year returns over the last four decades.
Ranking the Top S&P 500 Stocks
In order to find the top gainers, S&P took the top 10 best-performing stocks each year and then narrowed that list down to the top 50 overall. They ranked the top S&P 500 stocks by price returns, meaning that no dividends or stock distributions were included.
The best gains were clustered in a few select years, including the 1999 dot-com boom, the 2003 stock market rally, and the 2009 recovery from the Global Financial Crisis. None of the biggest gains happened in 2021 or 2022.
| Rank | Company | Sector | Return | Year |
|---|---|---|---|---|
| 1 | Qualcomm | Information Technology | 2620% | 1999 |
| 2 | Tesla | Consumer Discretionary | 743% | 2020 |
| 3 | DSC Communications | Communication Services | 468% | 1992 |
| 4 | Coleco Industries | Consumer Discretionary | 435% | 1982 |
| 5 | Avaya | Information Technology | 428% | 2003 |
| 6 | Chrysler | Consumer Discretionary | 426% | 1982 |
| 7 | XL Capital (Axa XL) | Financials | 395% | 2009 |
| 8 | Tenet Healthcare | Healthcare | 369% | 2009 |
| 9 | Dynegy | Utilities | 361% | 2000 |
| 10 | Advanced Micro Devices | Information Technology | 348% | 2009 |
| 11 | Sprint | Communication Services | 343% | 1999 |
| 12 | Ford | Consumer Discretionary | 337% | 2009 |
| 13 | NEXTEL Communications | Communication Services | 336% | 1999 |
| 14 | LSI Logic | Information Technology | 319% | 1999 |
| 15 | NVIDIA | Information Technology | 308% | 2001 |
| 16 | Nortel Networks | Communication Services | 304% | 1999 |
| 17 | Etsy | Consumer Discretionary | 302% | 2020 |
| 18 | Genworth Financial | Financials | 301% | 2009 |
| 19 | Micron Technology | Information Technology | 300% | 2009 |
| 20 | NetFlix | Communication Services | 298% | 2013 |
| 21 | Oracle | Information Technology | 290% | 1999 |
| 22 | Western Digital | Information Technology | 286% | 2009 |
| 23 | Network Appliance (NetApp) | Information Technology | 270% | 1999 |
| 24 | Data General | Information Technology | 267% | 1991 |
| 25 | Yahoo | Communication Services | 265% | 1999 |
| 26 | Williams Companies | Energy | 264% | 2003 |
| 27 | Novell | Information Technology | 264% | 1991 |
| 28 | Dynegy | Utilities | 263% | 2003 |
| 29 | Sun Microsystems | Information Technology | 262% | 1999 |
| 30 | PMC-Sierra | Information Technology | 262% | 2003 |
| 31 | Advanced Micro Devices | Information Technology | 259% | 1991 |
| 32 | Dell | Information Technology | 248% | 1998 |
| 33 | Global Marine | Energy | 247% | 1980 |
| 34 | Micron Technology | Information Technology | 243% | 2013 |
| 35 | Best Buy | Consumer Discretionary | 237% | 2013 |
| 36 | Reebok | Consumer Discretionary | 234% | 2000 |
| 37 | Freeport-McMoRan | Materials | 229% | 2009 |
| 38 | Biomet (Zimmer Biomet) | Healthcare | 226% | 1991 |
| 39 | NVIDIA | Information Technology | 224% | 2016 |
| 40 | Gap | Consumer Discretionary | 223% | 1991 |
| 41 | NetFlix | Communication Services | 219% | 2010 |
| 42 | Fleetwood Enterprises (Fleetwood RV) | Consumer Discretionary | 217% | 1982 |
| 43 | National Semiconductor | Information Technology | 217% | 1999 |
| 44 | Dell | Information Technology | 216% | 1997 |
| 45 | Tandy Corp (RadioShack) | Information Technology | 216% | 1980 |
| 46 | Novell | Information Technology | 215% | 2003 |
| 47 | Corning | Information Technology | 215% | 2003 |
| 48 | CB Richard Ellis (CBRE) | Real Estate | 214% | 2009 |
| 49 | AES Corp | Utilities | 213% | 2003 |
| 50 | Expedia | Consumer Discretionary | 212% | 2009 |
Qualcomm was by far the top-performer in any one calendar year window. The company had key patents for Code Division Multiple Access (CDMA) technology, which enabled fast wireless internet access and became the basis for 3G networks.
Its stock took off in 1999 as it shed less profitable business lines, resolved a patent dispute with competitor Ericsson, and joined the S&P 500 Index. At the time, CNN reported that one lucky investor who heard about Qualcomm from an investment-banker-turned-rabbi earned $17 million—roughly $30 million in today’s dollars.
The most recent stocks to make the rankings were both from 2020: well-known Tesla (#2) and lesser-known online marketplace Etsy (#17), which saw sales from independent creators surge during the early COVID-19 pandemic. The dollar value of items sold on Etsy more than doubled from $5.3 billion in 2019 to $10.3 billion in 2020, with mask sales accounting for 7% of the total.
Biggest Gainers in Each Sector
While information technology stocks made up nearly half of the list, there is representation from nine of the 11 S&P 500 sectors. No companies from the Industrials or Consumer Staples sectors made it into the ranks of the top S&P 500 stocks by annual returns.
Below, we show the stock with the best annual return for each sector.
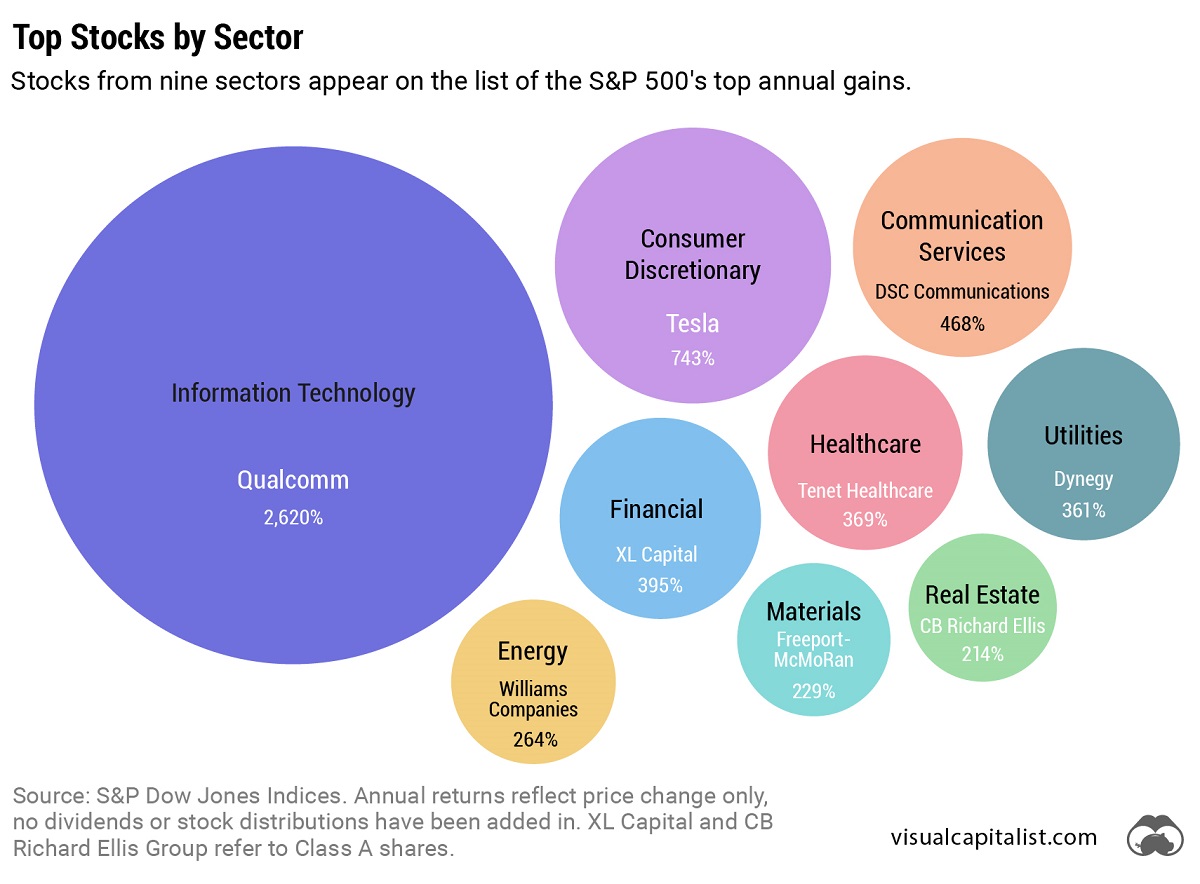
Tesla was the top-performing Consumer Discretionary stock on the list. After meeting the requirement of four consecutive quarters of positive earnings, it joined the S&P 500 Index on December 21, 2020. The company’s performance was boosted by the announcement that it would be included in the S&P 500, along with strong performance in China, and general EV buzz as environmental regulations tightened worldwide.
In the realm of Communication Services, DSC Communications saw a sizable return in 1992. The telecommunications equipment company had contracts with major companies such as Bell and Motorola. Alcatel-Lucent (then Alcatel), a French producer of mobile phones, purchased DSC Communications in 1998.
Serial Success Stories
It’s impressive to make the list of the top S&P 500 stocks by calendar returns once, but there are seven companies that have done it twice.
Some stocks saw their repeated outperformance close together, with Dell making the ranks back-to-back in 1997 and 1998.
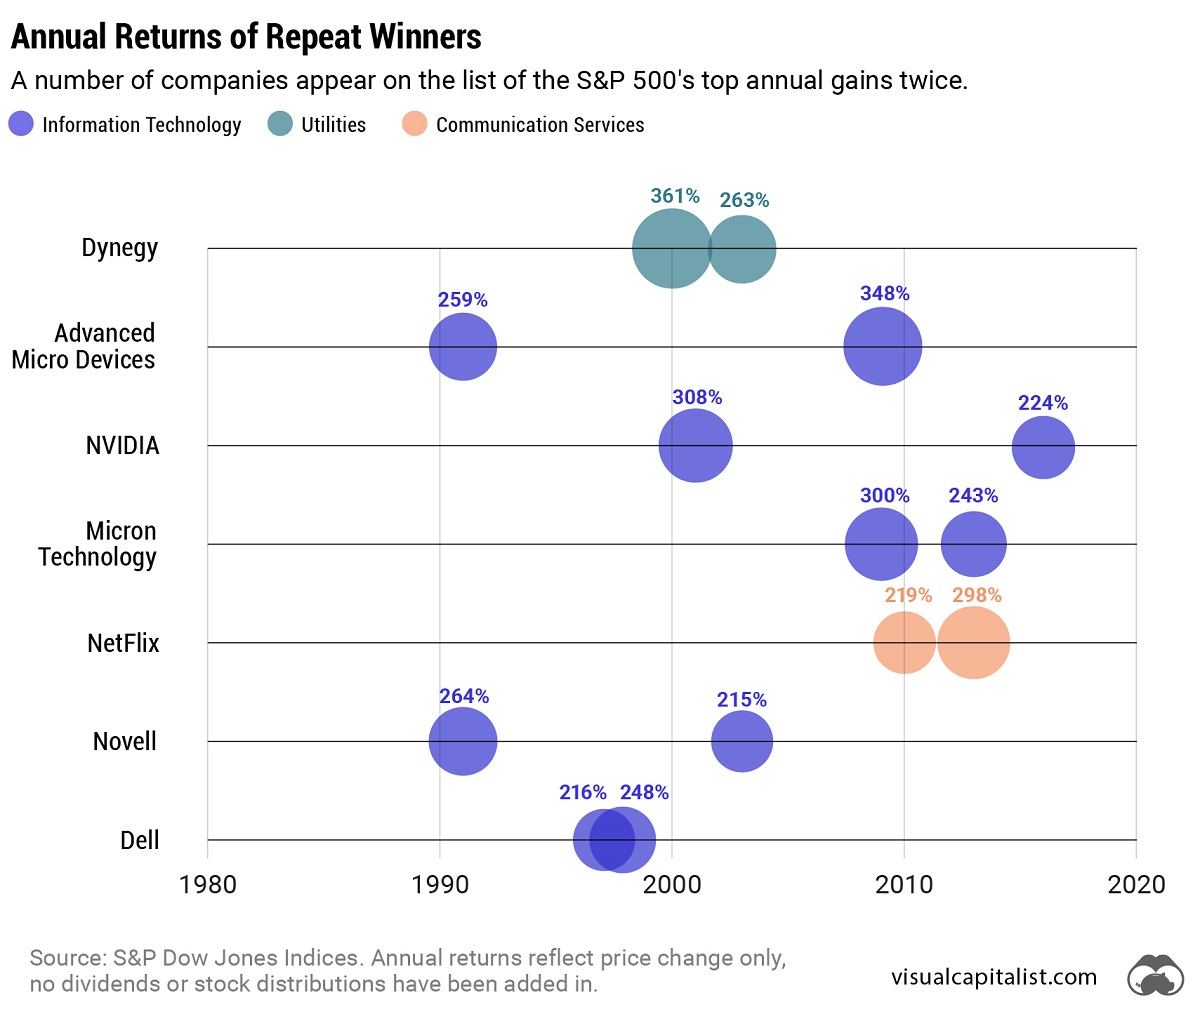
On the other hand, a select few have more staying power. Computing giant NVIDIA topped the charts in 2001 and triumphed again 15 years later in 2016. And this year might be another win, as the company has recently reached a $1 trillion market capitalization and has the highest year-to-date return in the S&P 500 as of July 6, 2023.

-
 Countries7 days ago
Mapped: World’s Top 40 Largest Military Budgets
-
 Energy3 weeks ago
How Old Are the World’s Nuclear Reactors?
-
 United States7 days ago
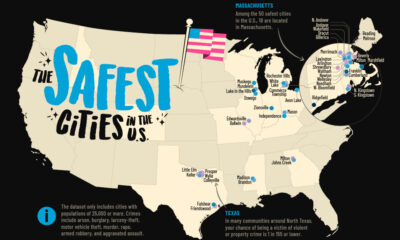
Mapped: The Safest Cities in the U.S.
-

 Energy3 weeks ago
How Big is the Market for Crude Oil?
-

 Technology5 days ago
How Long it Took for Popular Apps to Reach 100 Million Users
-
 Markets2 weeks ago
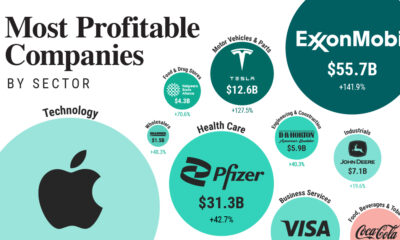
Ranked: The Most Profitable U.S. Companies, by Sector
-

 Environment5 days ago
Hotter Than Ever: 2023 Sets New Global Temperature Records
-
 Markets4 weeks ago
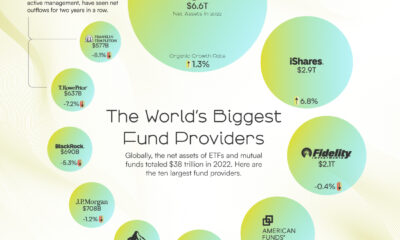
The World’s Biggest Mutual Fund and ETF Providers