Green
Visualizing the Flow of Energy-Related CO2 Emissions in the U.S.
Subscribe to the Decarbonization Channel’s free mailing list for more like this
Visualizing the Flow of Energy-Related CO2 Emissions in the U.S.
This was originally posted on the Decarbonization Channel. Subscribe to the free mailing list to be the first to see graphics related to decarbonization with a focus on the U.S. energy sector.
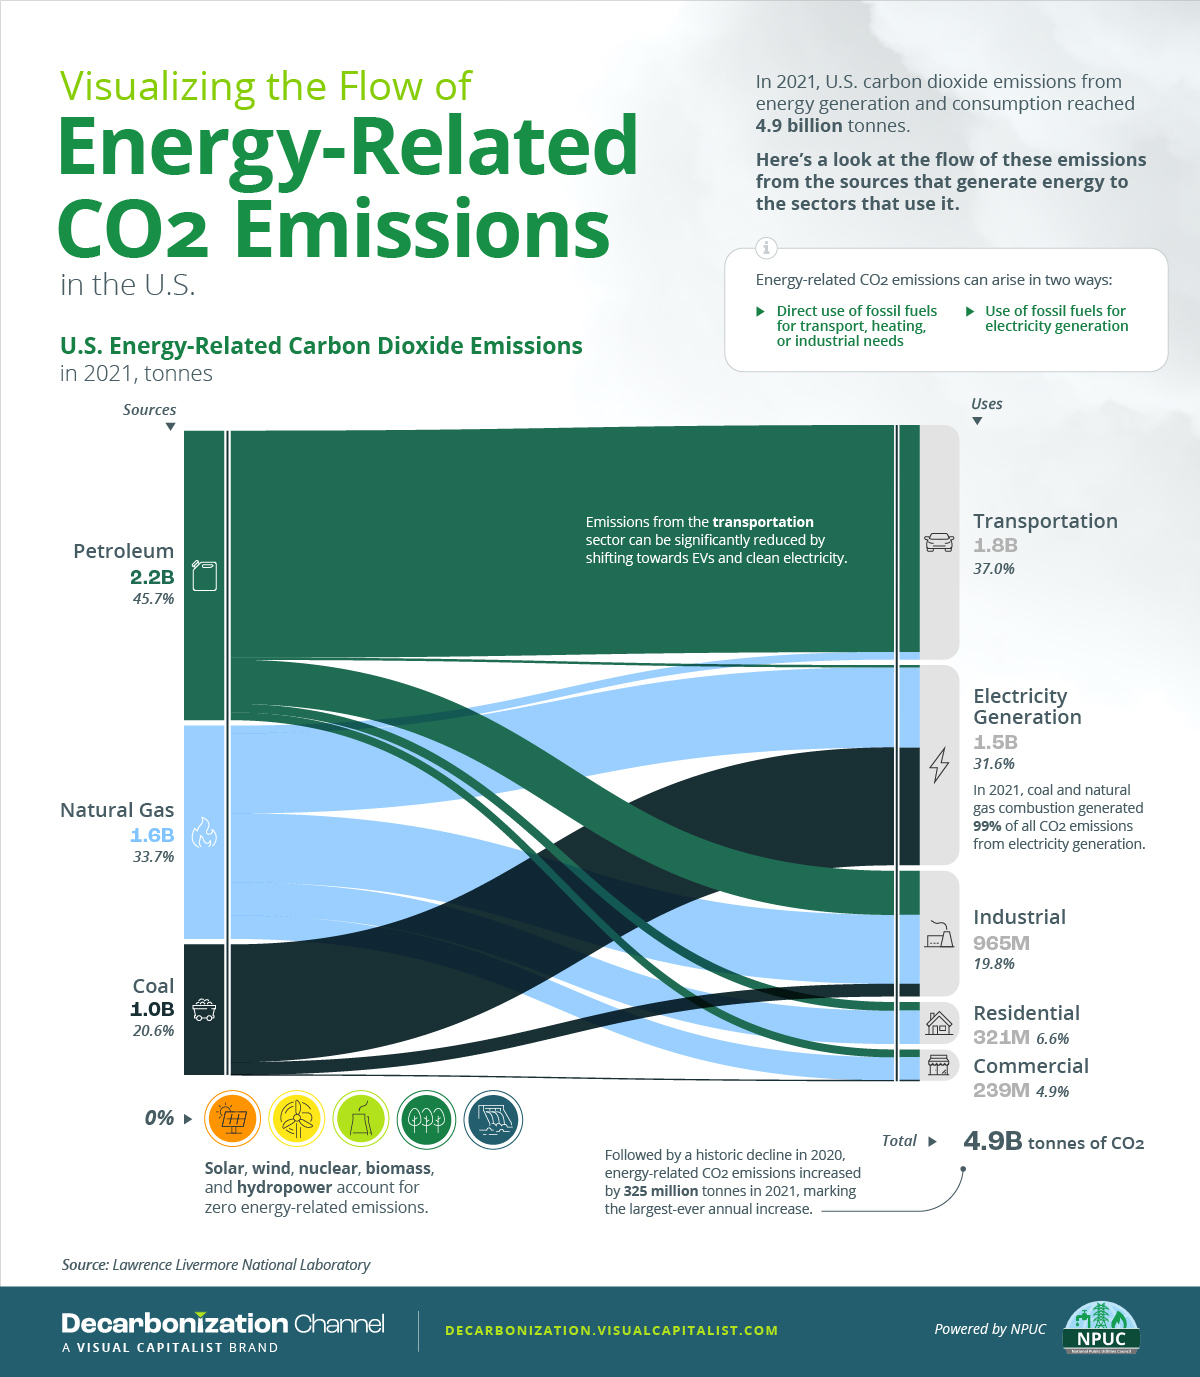
In 2021, U.S. carbon dioxide emissions from the generation and consumption of energy reached 4.9 billion tonnes.
To better understand how various energy sources and their end-uses contribute to carbon emissions, this graphic visualizes the flow of energy-related CO2 emissions in the U.S. using carbon flow charts by the Lawrence Livermore National Laboratory.
What are Energy-Related CO2 Emissions?
Energy-related CO2 emissions refer to the release of carbon dioxide as a result of the combustion of fuels to produce energy. They arise through the direct use of fossil fuels for transport, heating, or industrial needs, as well as the use of fossil fuels for electricity generation.
To provide some context, non-energy-related CO2 emissions are those that result from industrial chemical reactions, deforestation, and agricultural activities.
As the largest contributor to carbon emissions, however, energy-related CO2 emissions account for approximately 85% of all emissions in the U.S. which we will now explore in more detail.
U.S. Energy-Related CO2 Emissions in 2021
Followed by a pandemic-driven decline in 2020, energy-related carbon dioxide emissions in the U.S. increased by 325 million tonnes in 2021, marking the largest-ever annual increase.
| Energy Source | CO2 emissions in million tonnes, 2021 | % of total energy-related emissions |
|---|---|---|
| Petroleum | 2,223 | 45.7% |
| Natural Gas | 1,637 | 33.7% |
| Coal | 1,003 | 20.6% |
| Solar, Wind, Nuclear, Hydro, and Biomass | 0 | 0% |
| Total | 4,863 | 100% |
When we follow the CO2 emissions from the above fossil fuels to their end uses, transportation and electricity generation stand out as the biggest contributors.
In 2021, these two sectors accounted for more than 68% of all energy-related emissions in the country, roughly emitting 3.3 billion tonnes of CO2.
| End-Uses | CO2 emissions in million tonnes, 2021 | % of total energy-related emissions |
|---|---|---|
| Transportation | 1,801 | 37.0% |
| Electricity Generation | 1,537 | 31.6% |
| Industrial Uses | 965 | 19.8% |
| Residential Uses | 321 | 6.6% |
| Commercial Uses | 239 | 4.9% |
| Total | 4,863 | 100% |
When it comes to transportation, petroleum accounted for 97% of emissions, largely due to motor gasoline and diesel consumption. On the other hand, coal and natural gas made up 99% of CO2 emissions related to electricity generation.
Due to its high carbon intensity, coal’s contribution to power sector emissions may also be of particular interest. As the share of coal rose from 20% to 23% in the U.S. electricity mix in 2021, electricity emissions from coal also increased for the first time since 2014.
Naturally, this shift raised the overall energy-related CO2 emissions in 2021. It also caused a 4% hike in the carbon intensity of the country’s electricity.
Lowering Emissions
To avoid the impacts of climate change, many countries and companies are working towards decarbonization across all sectors, which can largely be facilitated by reductions in energy-related carbon emissions.
Accounting for nearly 70% of all energy-related CO2 emissions, transportation and utilities can be important pillars in these efforts.


Environment
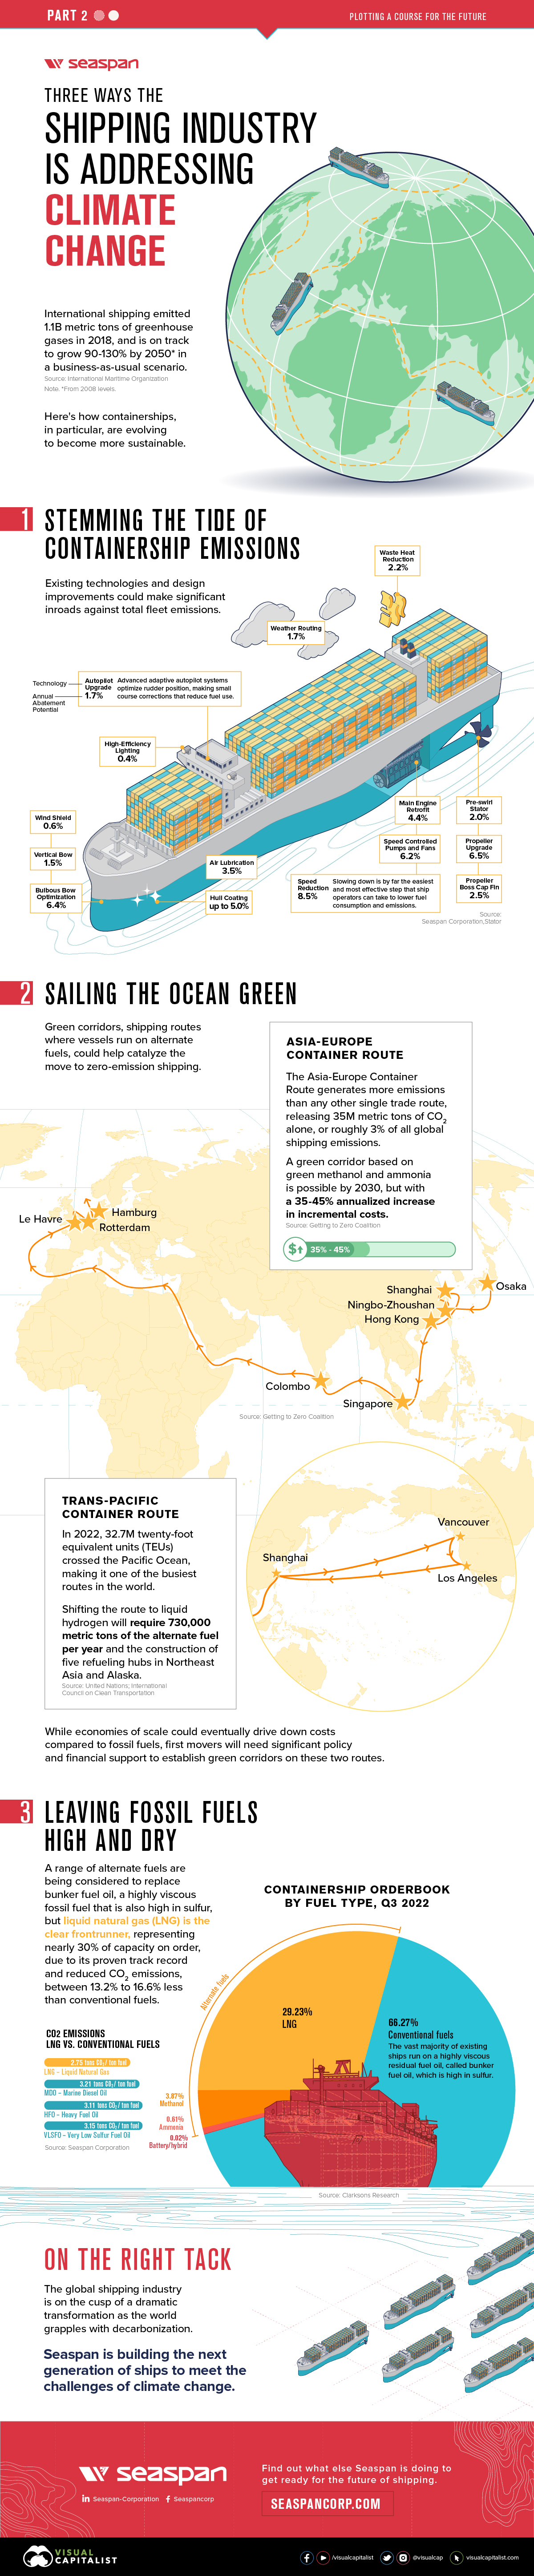
3 Ways the Shipping Industry is Addressing Climate Change
The shipping industry is responsible for 2.89% of all carbon emissions. Here are three ways it could evolve to address climate change.


3 Ways the Shipping Industry is Addressing Climate Change
The global shipping industry is on the verge of a transformation not seen since the transition from sail to steam.
In 2018, the industry emitted 1.1 billion metric tons of greenhouse gas emissions, representing 2.89% of all anthropogenic, or human-caused, emissions. And according to the International Maritime Organization (IMO) that could increase 90-130% in 2050, from a 2008 baseline.
This is the second and final part of The Shipping Industry: Plotting a Course for the Future, a two-part series from our sponsor Seaspan Corporation, that looks at three ways that containerships in particular, could evolve to become more sustainable.
1. Stemming the Tide of Containership Emissions
Unlike personal transport, which has a proven and commercially scalable technology in electric vehicles, there’s no silver bullet for shipping. However, existing technologies and design improvements could help make significant inroads against total fleet emissions.
According to data from Seaspan, propeller upgrades (6.5%), hull coatings (up to 5.0%), and main engine retrofits (4.4%) won’t bring emissions to zero on their own, but taken together they add up to big savings.
| Technology | Annual Abatement potential |
|---|---|
| Speed reduction | 8.5% |
| Propeller Upgrade | 6.5% |
| Bulbous bow optimization | 6.4% |
| Speed Controlled Pumps and Fans | 6.2% |
| Hull coating | 5.0% (up to) |
| Main engine retrofit | 4.4% |
| Air lubrication | 3.5% |
| Propeller boss cap fin | 2.5% |
| Waste Heat Reduction | 2.2% |
| Pre-swirl stator | 2.0% |
| Weather Routing | 1.7% |
| Autopilot Upgrade | 1.7% |
| Vertical bow | 1.5% |
| Wind shield | 0.6% |
| High-Efficiency Lighting | 0.4% |
Interestingly, the biggest potential impact could come from slowing down ships (8.5%), which lowers fuel consumption and as a consequence, emissions. In the race to net zero, slow and steady could very well win the race.
2. Sailing the Ocean Green
In the long run, though, design tweaks don’t address the elephant seal in the room, which is the industry’s reliance on fossil fuels. Ships that run on alternate fuels, like ammonia, methanol, and even wind-power, are all in development, but many of the technologies are still in the early stages.
To help spur development, a group of countries at COP26, the annual UN climate conference, committed to establishing green shipping corridors where vessels would run on alternate fuels. A total of 24 countries signed the Clydebank Declaration, including the U.S. and the UK, and together they hope to catalyze the shift to zero emission shipping.
3. Leaving Fossil Fuels High and Dry
Many ship owners and operators are looking at Liquid Natural Gas (LNG) as a transitional fuel, while alternate fuel technologies mature. LNG emits between 13.2% and 16.6% less CO2 than conventional bunker fuel oil, a highly viscous residual fuel that is high in sulfur, so it’s no surprise that LNG-powered containerships represent 29.23% of the existing orderbook.
But with all but 2.4% of the current global fleet running on fossil fuels, there is still a long journey ahead.
On the Right Tack
The 1997 Kyoto Protocol established the IMO as the forum for climate change action for the shipping industry, which many have criticized for not moving fast and far enough on climate change.
At the July 2023 meeting of the Marine Environment Protection Committee, the IMO adopted a new greenhouse gas strategy, which set “indicative checkpoints” for emission reductions for 2030 and 2040 in place of binding targets, and committed to hit net zero “by or around, i.e. close to 2050, taking into account different national circumstances.” The IMO also declined to put a price on carbon.
Even without firm targets, many industry players aren’t waiting to move on the climate emergency. Seaspan, the world’s largest independent charter owner and manager of containerships, is moving to green their fleet. They recently signed an agreement to retrofit 15 ships with dual-fuel engines that can also run on green methanol, with an option for 45 more.
Find out what else Seaspan is doing to get ready for the future of shipping.

-
 Energy4 weeks ago
Life Cycle Emissions: EVs vs. Combustion Engine Vehicles
We look at carbon emissions of electric, hybrid, and combustion engine vehicles through an analysis of their life cycle emissions.
-
 Green3 months ago
Mapped: Air Pollution Levels Around the World in 2022
Exploring 2022 average air pollution levels around the world by PM2.5 concentration.
-

 Environment10 months ago
Mapped: Countries With the Highest Flood Risk
Recent floods in Pakistan have affected more than 33 million people. Where is the risk of flooding highest around the world?
-

 Space11 months ago
All the Contents of the Universe, in One Graphic
We explore the ultimate frontier: the composition of the entire known universe, some of which are still being investigated today.
-

 Environment11 months ago
Explained: The Relationship Between Climate Change and Wildfires
More carbon in the atmosphere is creating a hotter world—and gradually fueling both climate change and instances of wildfires.
-

 Environment12 months ago
5 Things to Know About Europe’s Scorching Heatwave
Smoldering temperatures are wreaking havoc across Europe. Here are 5 key things you should know about Europe’s current heatwave.
-

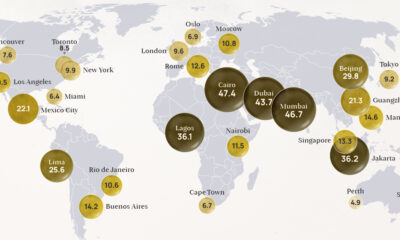
 Cities1 week ago
Mapped: The Most Dangerous Cities in the U.S.
-
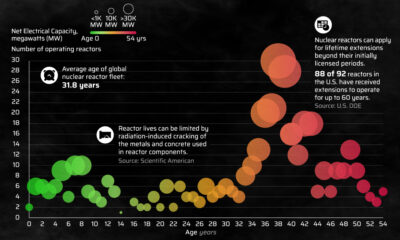
 Energy3 weeks ago
How Old Are the World’s Nuclear Reactors?
-
 Countries7 days ago
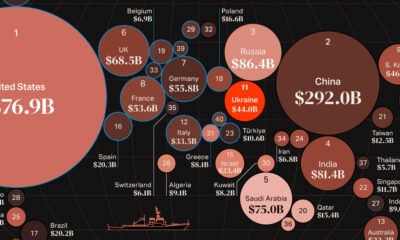
Mapped: World’s Top 40 Largest Military Budgets
-

 Energy3 weeks ago
How Big is the Market for Crude Oil?
-

 United States6 days ago
Mapped: The Safest Cities in the U.S.
-
 Markets2 weeks ago
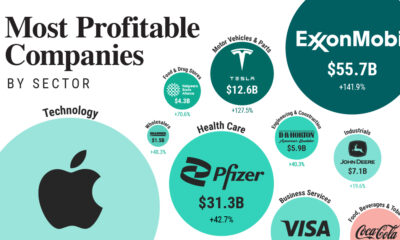
Ranked: The Most Profitable U.S. Companies, by Sector
-

 Technology5 days ago
How Long it Took for Popular Apps to Reach 100 Million Users
-
 Markets4 weeks ago
The World’s Biggest Mutual Fund and ETF Providers