Money
Visualizing the Assets and Liabilities of U.S. Banks
![]() Subscribe to the Elements free mailing list for more like this
Subscribe to the Elements free mailing list for more like this


Understanding the Assets and Liabilities of U.S. Banks
This was originally posted on Elements. Sign up to the free mailing list to get beautiful visualizations on real assets and resource megatrends each week.
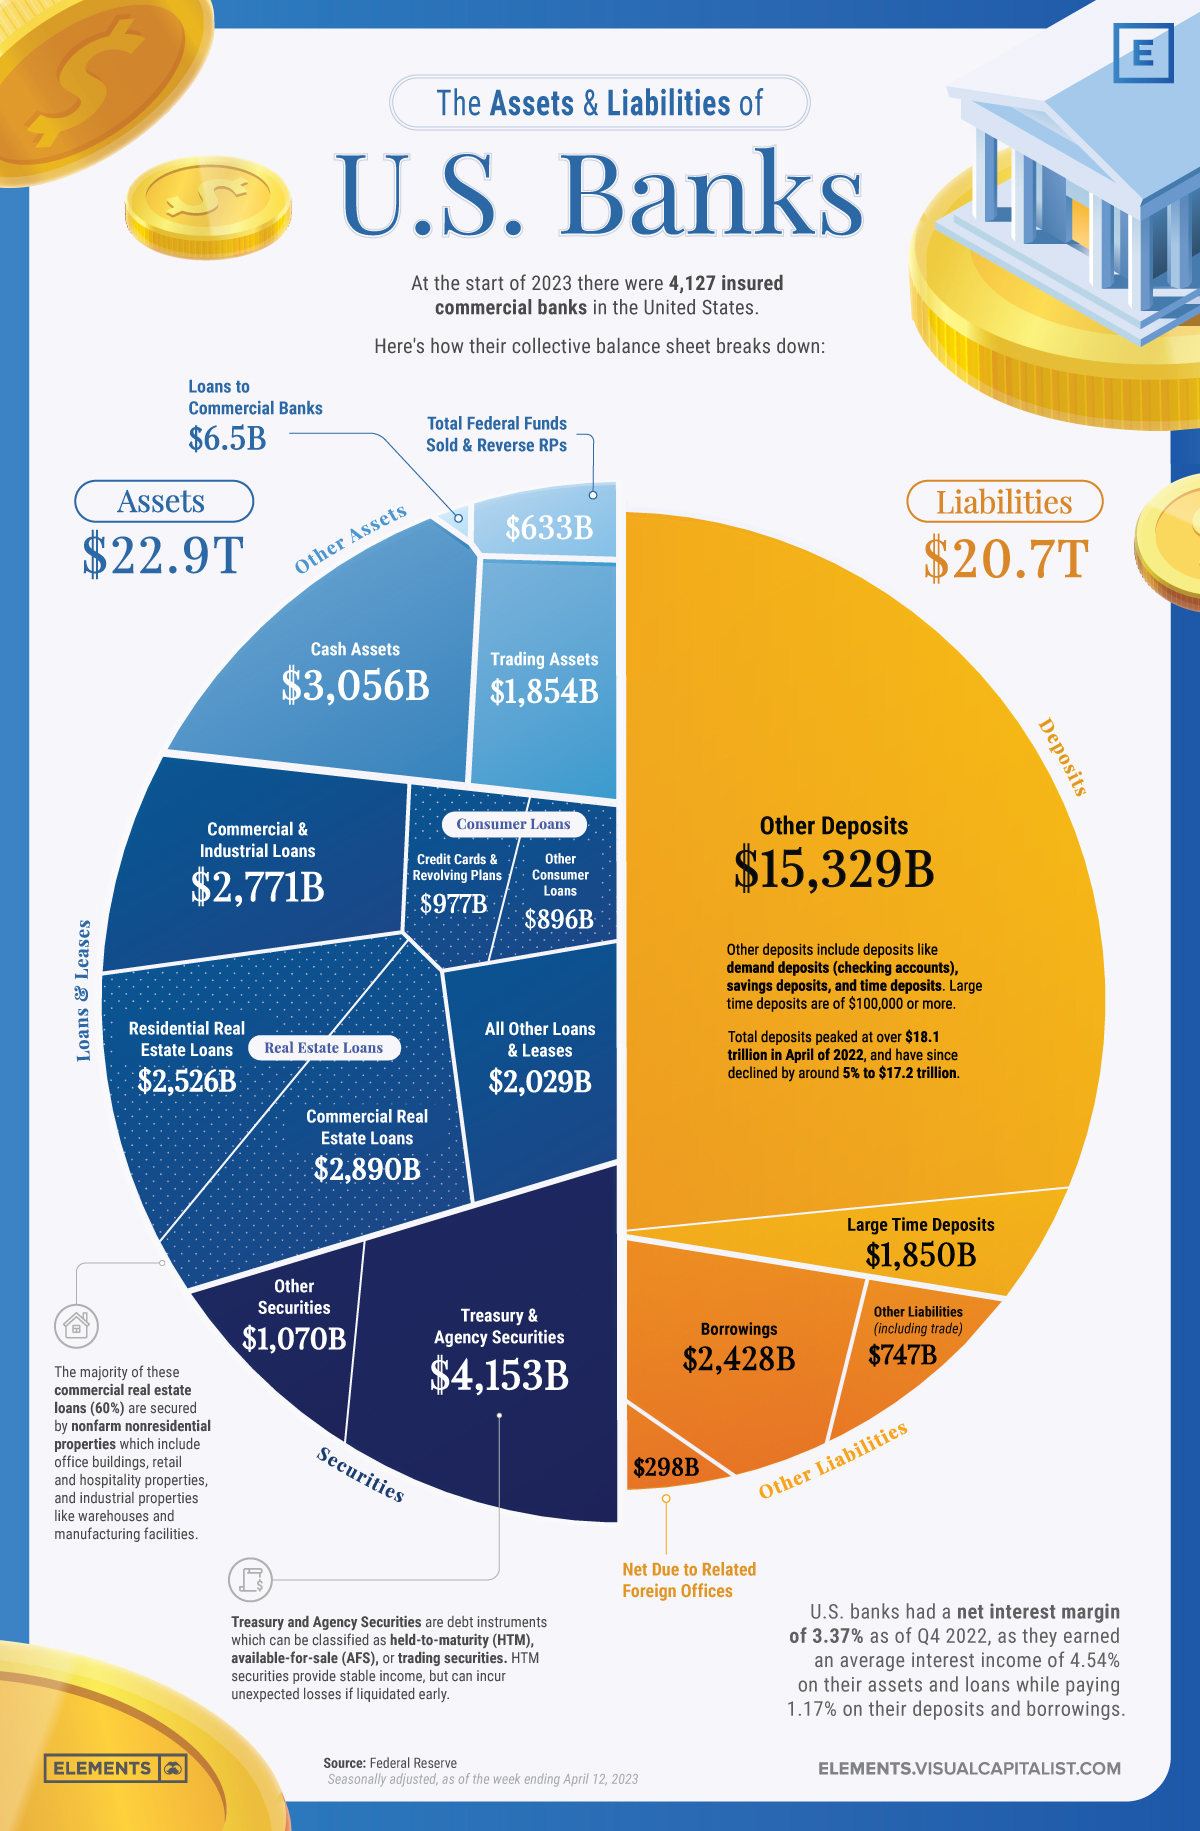
The U.S. banking sector has more than 4,000 FDIC-insured banks that play a crucial role in the country’s economy by securely storing deposits and providing credit in the form of loans.
This infographic visualizes all of the deposits, loans, and other assets and liabilities that make up the collective balance sheet of U.S banks using data from the Federal Reserve.
With the spotlight on the banking sector after the collapses of Signature Bank, Silicon Valley Bank, and First Republic bank, understanding the assets and liabilities that make up banks’ balance sheets can give insight in how they operate and why they sometimes fail.
Assets: The Building Blocks of Banks’ Business
Assets are the foundation of a bank’s operations, serving as a base to provide loans and credit while also generating income.
A healthy asset portfolio with a mix of loans along with long-dated and short-dated securities is essential for a bank’s financial stability, especially since assets not marked to market may have a lower value than expected if liquidated early.
As of Q4 2022, U.S. banks generated an average interest income of 4.54% on all assets.
Loans and Leases
Loans and leases are the primary income-generating assets for banks, making up 53% of the assets held by U.S. banks.
These include:
- Real estate loans for residential and commercial properties (45% of all loans and leases)
- Commercial and industrial loans for business operations (23% of all loans and leases)
- Consumer loans for personal needs like credit cards and auto loans (15% of all loans and leases)
- Various other kinds of credit (17% of all loans and leases)
Securities
Securities make up the next largest portion of U.S. banks’ assets (23%) at $5.2 trillion. Banks primarily invest in Treasury and agency securities, which are debt instruments issued by the U.S. government and its agencies.
These securities can be categorized into three types:
- Held-to-maturity (HTM) securities, which are held until they mature and provide a stable income stream
- Available-for-sale (AFS) securities, which can be sold before maturity
- Trading securities, held for short-term trading to profit from price fluctuations
Along with Treasury and agency securities which make up the significant majority (80%) of U.S. banks’ securities, banks also invest in other securities which are non-government-issued debt instruments like corporate bonds, mortgage-backed securities, and asset-backed securities.
Cash Assets
Cash assets are a small but essential part of U.S. banks’ balance sheets, making up $3.1 trillion or 13% of all assets. Having enough cash assets ensures adequate liquidity needed to meet short-term obligations and regulatory requirements.
Cash assets include physical currency held in bank vaults, pending collections, and cash balances in accounts with other banks.
Liabilities: Banks’ Financial Obligations
Liabilities represent the obligations banks must fulfill, including customer deposits and borrowings. Careful management of liabilities is essential to maintain liquidity, manage risk, and ensure a bank’s overall solvency.
Deposits
Deposits make up the largest portion of banks’ liabilities as they represent the money that customers entrust to these institutions. It’s important to note that the FDIC insures deposit accounts up to $250,000 per depositor, per insured bank, for each type of account (like single accounts, joint accounts, and retirement accounts).
There are two primary types of deposits, large time deposits and other deposits. Large time deposits are defined by the FDIC as time deposits exceeding $100,000, while other deposits include checking accounts, savings accounts, and smaller time deposits.
U.S. banks had $17.18 trillion in overall deposits as of April 12th 2023, with other deposits accounting for 74% of the overall liabilities while large time deposits made up 9%.
Borrowings
After deposits, borrowings are the next largest liability on the balance sheet of U.S. banks, making up nearly 12% of all liabilities at $2.4 trillion.
These include short-term borrowings from other banks or financial institutions such as Federal Funds and repurchase agreements, along with long-term borrowings like subordinated debt which ranks below other loans and securities in the event of a default.
How Deposits, Rates, and Balance Sheets Affect Bank Failures
Just like any other business, banks have to balance their finances to remain solvent; however, successful banking also relies heavily on the trust of depositors.
While in other businesses an erosion of trust with customers might lead to breakdowns in future business deals and revenues, only in banking can a dissolution in customer trust swiftly turn into the immediate removal of deposits that backstop all revenue-generating opportunities.
Although recent bank collapses aren’t solely due to depositors withdrawing funds, bank runs have played a significant role. Most recently, in First Republic’s case, depositors pulled out more than $101 billion in Q1 of 2023, which would’ve been more than 50% of their total deposits, had some of America’s largest banks not injected $30 billion in deposits on March 16th.
It’s important to remember that the rapidly spreading fires of bank runs are initially sparked by poor asset management, which can sometimes be detected on banks’ balance sheets.
A combination of excessive investment in long-dated held-to-maturity securities, one of the fastest rate hiking cycles in recent history, and many depositors fearing for and moving their uninsured deposits of over $250,000 has resulted in the worst year ever for bank failures in terms of total assets.


Money
Animated: Change in Russian Billionaires’ Wealth Since 2022
How have Russian billionaires fared since Russia’s invasion of Ukraine? This animation tracks the wealth of 22 Russian billionaires.
 Creator Program
Animated: Change in Russian Billionaires’ Wealth Since 2022
When Russia invaded Ukraine in February 2022, many countries retaliated with sanctions targeting Russian billionaires—the oligarchs—and politicians directly.
And as the war has progressed, those sanctions have intensified, with even the relatives and shell companies of these billionaires being targeted over time. The reason? These oligarchs are interconnected to Russia’s government, lending vocal and fiscal support in exchange for sweetheart deals or beneficial government oversight.
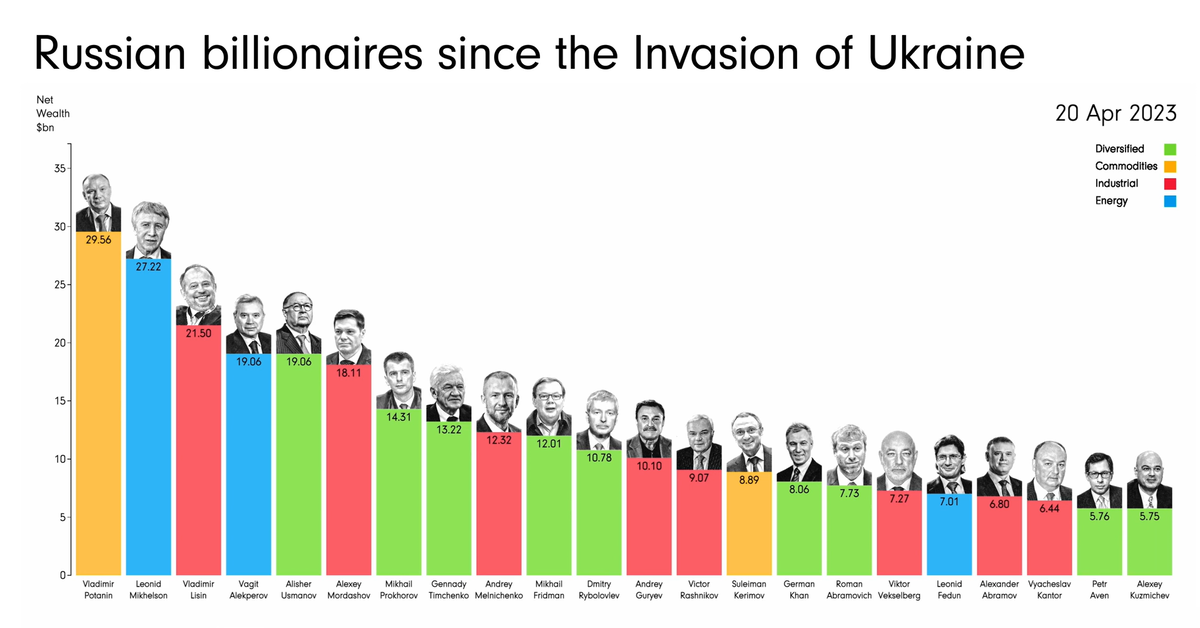
This animation from James Eagle shows how the estimated net wealth of the 22 wealthiest Russian billionaires on the Bloomberg Billionaires Index in April 2023 has changed since January 2022, prior to the start of the conflict.
Net Wealth of Top Russian Billionaires
The 22 wealthiest Russian billionaires in April 20, 2023 lost a collective $90.4 billion in net worth since January 5, 2022.
| Rank | Name | Main Industry | Net Wealth (Apr 20, 2023) | Net Wealth (Jan 5, 2022) | % Change |
|---|---|---|---|---|---|
| 1 | Vladimir Potanin | Commodities | $29.6B | $31.1B | -4.8% |
| 2 | Leonid Mikhelson | Energy | $27.2B | $33.2B | -18.1% |
| 3 | Vladimir Lisin | Industrial | $21.5B | $28.0B | -23.2% |
| 4 | Vagit Alekperov | Energy | $19.1B | $22.8B | -16.2% |
| 5 | Alisher Usmanov | Diversified | $19.1B | $21.2B | -9.9% |
| 6 | Alexey Mordashov | Industrial | $18.1B | $29.1B | -37.8% |
| 7 | Mikhail Prokhorov | Diversified | $14.3B | $14.0B | 2.1% |
| 8 | Gennady Timchenko | Diversified | $13.2B | $23.1B | -42.9% |
| 9 | Andrey Melnichenko | Industrial | $12.3B | $17.8B | -30.9% |
| 10 | Mikhail Fridman | Diversified | $12.0B | $14.1B | -14.9% |
| 11 | Dmitry Rybolovlev | Diversified | $10.8B | $11.2B | -3.6% |
| 12 | Andrey Guryev | Industrial | $10.1B | $8.0B | 26.3% |
| 13 | Victor Rashnikov | Industrial | $9.1B | $14.4B | -36.8% |
| 14 | Suleiman Kerimov | Commodities | $8.9B | $15.2B | -41.4% |
| 15 | German Khan | Diversified | $8.1B | $9.6B | -15.6% |
| 16 | Roman Abramovich | Diversified | $7.7B | $18.2B | -57.7% |
| 17 | Viktor Vekselberg | Industrial | $7.3B | $18.6B | -60.8% |
| 18 | Leonid Fedun | Energy | $7.0B | $8.9B | -21.3% |
| 19 | Alexander Abramov | Industrial | $6.8B | $9.1B | -25.3% |
| 20 | Vyacheslav Kantor | Industrial | $6.4B | $9.1B | -29.7% |
| 21 | Petr Aven | Diversified | $5.8B | $6.6B | -12.1% |
| 22 | Alexey Kuzmichev | Diversified | $5.8B | $7.3B | -20.5% |
The heaviest hit include Viktor Vekselberg, who holds a stake in UC Rusal, the world’s third largest aluminum producer. Since the start of the war, he’s lost an estimated $11.3 billion or 61% of his net worth from January 2022.
Roman Abramovich, who got his start in the early oligarchy through oil conglomerates, was also hit hard by the sanctions. He lost $10.5 billion or 58% of his net worth from January 2022, and was forced to sell Chelsea Football Club in one of the biggest sports team sales in history.
Notably, the richest oligarchs haven’t lost as much. Mining giant Norilsk Nickel’s largest shareholder, Vladimir Potanin, saw his net worth only drop by 4.8%. After being hit hard at the onset of the war in Ukraine, he quickly rebounded and at many times had an even higher net worth, reaching $35.6 billion in June 2022.
And a few oligarchs, like former Norilsk Nickel CEO Mikhail Prokhorov and phosphate-based fertilizer baron Andrey Guryev, saw their wealth increase since January 2022. Guryev grew his net worth by $2 billion or 26%, while Prokhorov (who formerly owned the NBA’s Brooklyn Nets) saw his net worth even out at a gain of $0.3 billion or 2%.
Oligarch Support of Russia (or Lack Thereof)
As Russia’s war with Ukraine has dragged on, and sanctions have continued to weigh on Russian billionaires, politicians, and companies, their effects have been uncertain.
Oligarchs have lost net worth, relinquished foreign businesses, and even had prized possessions like mansions and yachts seized. At the same time, though Russia’s economy has weakened under sanctions, bolstered trade with countries like China, India, and Saudi Arabia have kept it stronger than expected.
And though some oligarchs have voiced various concerns over the ongoing war, the wealthiest have been careful to toe the line. Russian billionaires and politicians that did vocalize criticism, including Lukoil chairman Ravil Maganov, have been found dead in apparent suicides, heart attacks, and accidents.
The most serious oligarch rebellion wasn’t due to economic hardships, but military operations. Oligarch and mercenary leader Yevgeny Prigozhin launched an attempted coup in June 2023, reportedly retreating after support from within Russia’s military quickly fizzled.

-

 Markets2 weeks ago
Visualizing 1 Billion Square Feet of Empty Office Space
-

 Energy4 weeks ago
Life Cycle Emissions: EVs vs. Combustion Engine Vehicles
-

 Maps2 weeks ago
Vintage Viz: The World’s Rivers and Lakes, Organized Neatly
-

 Markets3 weeks ago
Visualized: The 100 Largest U.S. Banks by Consolidated Assets
-

 Automation1 week ago
Charted: Changing Sentiments Towards AI in the Workplace
-

 Markets3 weeks ago
What are Top Investment Managers Holding in Their Portfolios?
-

 Markets1 week ago
The 50 Best One-Year Returns on the S&P 500 (1980-2022)
-

 United States3 weeks ago
Chart: U.S. Home Price Growth Over 50 Years