United States
Mapped: The Safest Cities in the U.S.
Mapped: The Safest Cities in America
The phrase “small town America” often conjures up images of white picket fences, well-trimmed lawns, and big houses. But how safe is modern-day suburbia in America?
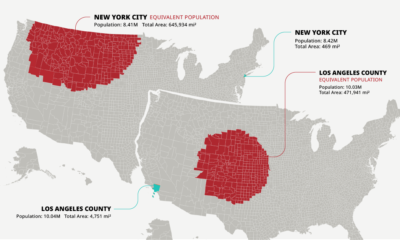
Some of the smallest places in the country can actually be among the most dangerous. Take for example Bessemer, Alabama, with a population of around 26,000 and a violent crime rate of 33.1 per every 1,000 residents.
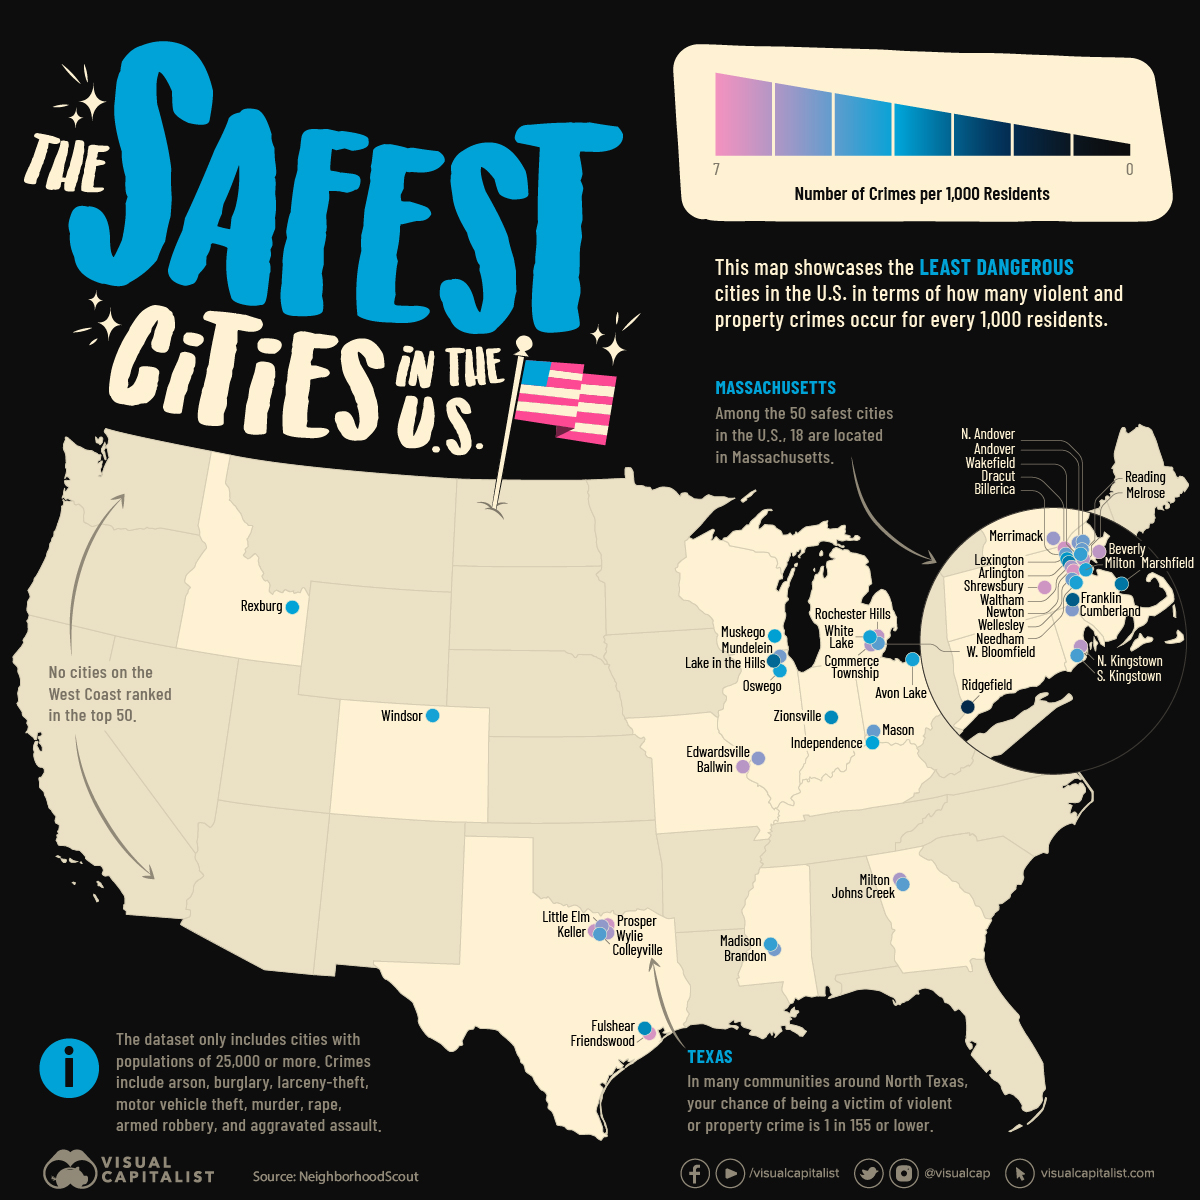
That said, there are many small cities that are true havens for families across the United States. This map showcases the safest cities in the U.S., using FBI data and Census Bureau populations compiled by NeighborhoodScout in 2023.
Note: The source only considered cities with a population of 25,000 or higher. This report is based on total index crimes reported in each city, which includes arson, burglary, larceny-theft, motor vehicle theft, murder, rape, armed robbery, and aggravated assault.
Top 100 Safest Cities in the U.S.
40% of the cities in the ranking are located in Northeastern states, which are typically rated the “safest” based on FBI data.
Here’s a closer look at the full list:
| Rank | City | State | Total Crime Rate(per 1,000 residents) | Chance of Beinga Victim |
|---|---|---|---|---|
| 1 | Ridgefield | Connecticut | 1.9 | 1 in 510 |
| 2 | Franklin | Massachusetts | 2.9 | 1 in 344 |
| 3 | Lake in the Hills | Illinois | 3.1 | 1 in 321 |
| 4 | Marshfield | Massachusetts | 3.3 | 1 in 300 |
| 5 | Arlington | Massachusetts | 3.4 | 1 in 292 |
| 6 | Fulshear | Texas | 3.6 | 1 in 276 |
| 7 | Zionsville | Indiana | 3.6 | 1 in 275 |
| 8 | Lexington | Massachusetts | 3.7 | 1 in 270 |
| 9 | Muskego | Wisconsin | 3.8 | 1 in 265 |
| 10 | Rexburg | Idaho | 3.9 | 1 in 253 |
| 11 | Independence | Kentucky | 3.9 | 1 in 253 |
| 12 | Oswego | Illinois | 4.1 | 1 in 238 |
| 13 | Milton | Massachusetts | 4.2 | 1 in 233 |
| 14 | Needham | Massachusetts | 4.2 | 1 in 233 |
| 15 | White Lake | Michigan | 4.2 | 1 in 233 |
| 16 | Avon Lake | Ohio | 4.3 | 1 in 232 |
| 17 | Madison | Mississippi | 4.5 | 1 in 221 |
| 18 | Wakefield | Massachusetts | 4.5 | 1 in 218 |
| 19 | Windsor | Colorado | 4.5 | 1 in 218 |
| 20 | South Kingstown | Rhode Island | 4.7 | 1 in 212 |
| 21 | Colleyville | Texas | 4.8 | 1 in 206 |
| 22 | West Bloomfield | Michigan | 4.9 | 1 in 204 |
| 23 | Johns Creek | Georgia | 4.9 | 1 in 202 |
| 24 | Billerica | Massachusetts | 5.1 | 1 in 195 |
| 25 | Mason | Ohio | 5.1 | 1 in 192 |
| 26 | Reading | Massachusetts | 5.1 | 1 in 192 |
| 27 | North Andover | Massachusetts | 5.2 | 1 in 190 |
| 28 | Wellesley | Massachusetts | 5.2 | 1 in 189 |
| 29 | Mundelein | Illinois | 5.3 | 1 in 187 |
| 30 | Brandon | Mississippi | 5.3 | 1 in 186 |
| 31 | Cumberland | Rhode Island | 5.4 | 1 in 184 |
| 32 | Andover | Massachusetts | 5.4 | 1 in 182 |
| 33 | Edwardsville | Illinois | 5.5 | 1 in 178 |
| 34 | Little Elm | Texas | 5.6 | 1 in 176 |
| 35 | Merrimack | New Hampshire | 5.7 | 1 in 172 |
| 36 | Waltham | Massachusetts | 5.8 | 1 in 169 |
| 37 | Wylie | Texas | 5.9 | 1 in 169 |
| 38 | Commerce Township | Michigan | 5.9 | 1 in 169 |
| 39 | Milton | Georgia | 5.9 | 1 in 167 |
| 40 | Melrose | Massachusetts | 6.0 | 1 in 164 |
| 41 | Ballwin | Missouri | 6.1 | 1 in 162 |
| 42 | North Kingstown | Rhode Island | 6.1 | 1 in 162 |
| 43 | Beverly | Massachusetts | 6.2 | 1 in 161 |
| 44 | Rochester Hills | Michigan | 6.2 | 1 in 160 |
| 45 | Keller | Texas | 6.3 | 1 in 158 |
| 46 | Shrewsbury | Massachusetts | 6.4 | 1 in 156 |
| 47 | Dracut | Massachusetts | 6.4 | 1 in 155 |
| 48 | Prosper | Texas | 6.4 | 1 in 155 |
| 49 | Newton | Massachusetts | 6.5 | 1 in 152 |
| 50 | Friendswood | Texas | 6.5 | 1 in 152 |
| 51 | McHenry | Illinois | 6.5 | 1 in 152 |
| 52 | Fort Mill | South Carolina | 6.6 | 1 in 151 |
| 53 | Wallingford | Connecticut | 6.8 | 1 in 146 |
| 54 | Caledonia | Wisconsin | 6.9 | 1 in 144 |
| 55 | Belmont | Massachusetts | 6.9 | 1 in 144 |
| 56 | De Pere | Wisconsin | 6.9 | 1 in 143 |
| 57 | Flower Mound | Texas | 7.0 | 1 in 142 |
| 58 | Easton | Massachusetts | 7.0 | 1 in 141 |
| 59 | Highland Park | Illinois | 7.0 | 1 in 141 |
| 60 | Carmel | Indiana | 7.2 | 1 in 138 |
| 61 | Sachse | Texas | 7.2 | 1 in 138 |
| 62 | Algonquin | Illinois | 7.2 | 1 in 137 |
| 63 | Hendersonville | Tennessee | 7.2 | 1 in 137 |
| 64 | San Luis | Arizona | 7.3 | 1 in 136 |
| 65 | Fishers | Indiana | 7.3 | 1 in 135 |
| 66 | Perrysburg | Ohio | 7.4 | 1 in 135 |
| 67 | Lake Stevens | Washington | 7.4 | 1 in 134 |
| 68 | Cheshire | Connecticut | 7.4 | 1 in 134 |
| 69 | Milford | Massachusetts | 7.5 | 1 in 132 |
| 70 | Saratoga Springs | Utah | 7.5 | 1 in 132 |
| 71 | Bella Vista | Arkansas | 7.5 | 1 in 132 |
| 72 | Princeton | New Jersey | 7.5 | 1 in 131 |
| 73 | Bluffton | South Carolina | 7.6 | 1 in 130 |
| 74 | Novi | Michigan | 7.6 | 1 in 130 |
| 75 | Chelmsford | Massachusetts | 7.6 | 1 in 130 |
| 76 | Amherst | Massachusetts | 7.7 | 1 in 129 |
| 77 | Rosemount | Minnesota | 7.7 | 1 in 129 |
| 78 | Gloucester | Massachusetts | 7.7 | 1 in 129 |
| 79 | Syracuse | Utah | 7.8 | 1 in 127 |
| 80 | Waukee | Iowa | 7.8 | 1 in 126 |
| 81 | Mequon | Wisconsin | 7.9 | 1 in 126 |
| 82 | Westfield | Indiana | 7.9 | 1 in 126 |
| 83 | Spring Hill | Tennessee | 7.9 | 1 in 126 |
| 84 | Upper Arlington | Ohio | 7.9 | 1 in 126 |
| 85 | Rahway | New Jersey | 7.9 | 1 in 125 |
| 86 | Montclair | New Jersey | 7.9 | 1 in 125 |
| 87 | Greenwich | Connecticut | 8.0 | 1 in 125 |
| 88 | Hutto | Texas | 8.0 | 1 in 124 |
| 89 | Vestavia Hills | Alabama | 8.0 | 1 in 123 |
| 90 | Brownsburg | Indiana | 8.1 | 1 in 123 |
| 91 | Wilmette | Illinois | 8.1 | 1 in 123 |
| 92 | New Milford | Connecticut | 8.1 | 1 in 122 |
| 93 | Hilliard | Ohio | 8.2 | 1 in 120 |
| 94 | Royal Oak | Michigan | 8.2 | 1 in 120 |
| 95 | Derry | New Hampshire | 8.3 | 1 in 121 |
| 96 | Dublin | Ohio | 8.3 | 1 in 120 |
| 97 | West Warwick | Rhode Island | 8.5 | 1 in 116 |
| 98 | Watertown | Massachusetts | 8.5 | 1 in 116 |
| 99 | Walpole | Massachusetts | 8.6 | 1 in 115 |
| 100 | Kaysville | Utah | 8.6 | 1 in 115 |
One quarter of the safest cities are located in Massachusetts, with the vast majority clustered around Boston.
The median population of the cities and towns in the top 100 is just 32,000, and few widely-recognized cities make the list. Carmel, Indiana (#60) is the only city with a population above 100,000 to make the rankings. This would seem to follow the logic that bigger cities are more dangerous, but our map covering the most dangerous cities in America shows that many small cities were just as dangerous, and some even more.
Regardless, small towns can truly be idyllic. For example, a person’s chance of falling victim to crime in Ridgefield, Connecticut, the safest ranked city in the U.S., is just 1-in-510. That’s an overall rate of fewer than two incidents of crime per every 1,000 residents.
One surprising observation from the data is that many of the safest U.S. cities are in very close proximity to some of the most dangerous.
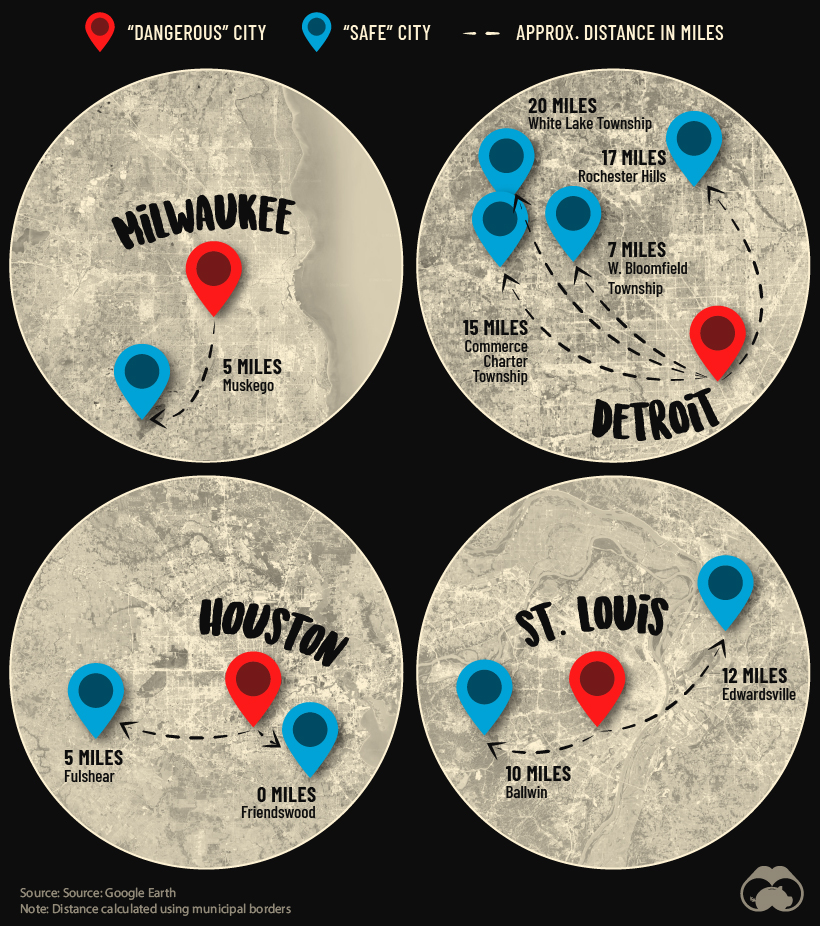
One example that illustrates this is Detroit, which ranks as the sixth most dangerous city in America. Despite this, as shown on the map above, there are four communities nearby that have some of the lowest crime rates in America.
In other words, America’s metro areas contain much contrast, and these insights provide valuable information for individuals and families seeking secure places to live across the country.


Cities
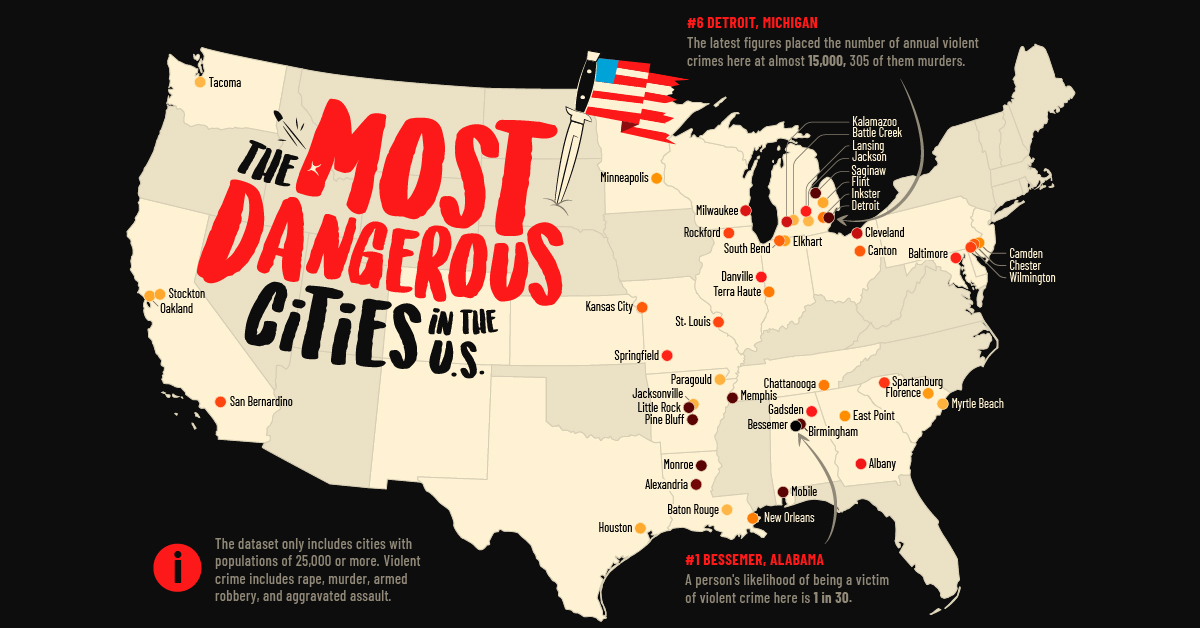
Mapped: The Most Dangerous Cities in the U.S.
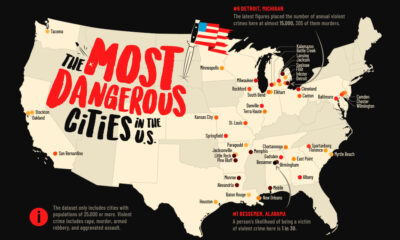
This map shows the most dangerous cities in the U.S. in terms of the violent crime rate per 1,000 residents.
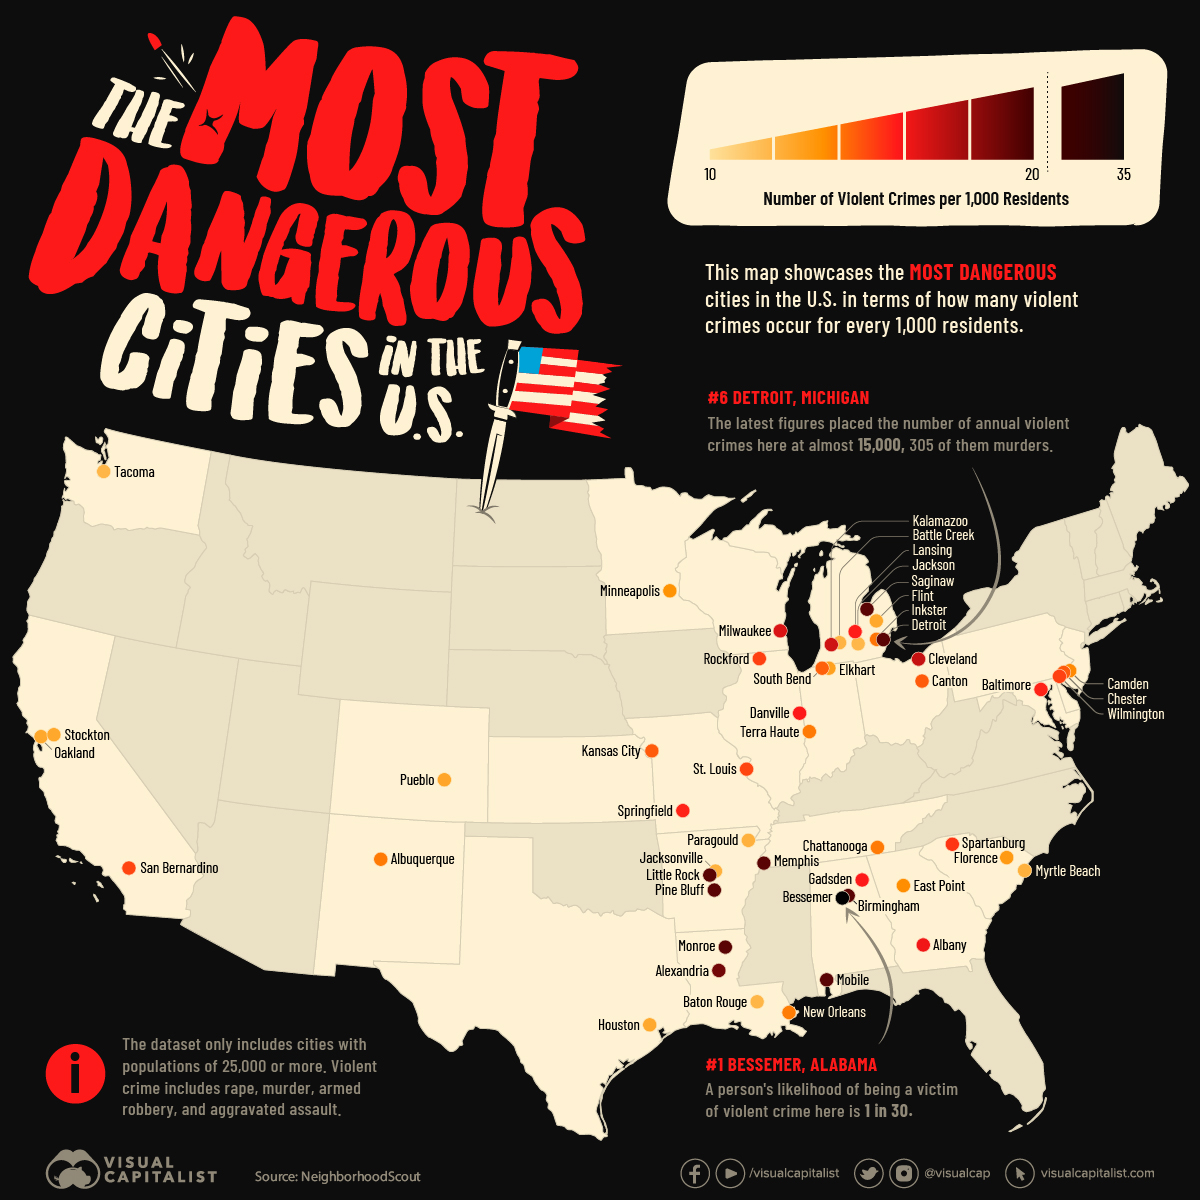
Mapped: The Most Dangerous Cities in the U.S.
Crime is seemingly always increasing—at least according to the headlines.
The focus is usually on big cities like Chicago or San Francisco, but some of the most dangerous cities in the U.S. are actually smaller or suburban cities, at least according to new per capita data from NeighborhoodScout.
The map above reveals the most dangerous urban areas in the U.S., in terms of how many violent crimes occur for every 1,000 residents. It uses the latest FBI crime data and Census Bureau populations available in 2023.
Note: The source only considered cities with a population of 25,000 or higher. This report is based on reported violent crimes including armed robbery, murder, rape, and aggravated assault.
Top 100 Most Dangerous Cities in the U.S.
Though the most dangerous cities in the U.S. are spread across multiple states, Alabama is home to three of the 10 cities with the highest violent crime rates: Bessemer (#1), Mobile (#2), and Birmingham (#7).
Here’s a closer look at the full list:
| Rank | City | State | Violent Crime Rate(per 1,000 residents) | Chance of Beinga Victim |
|---|---|---|---|---|
| 1 | Bessemer | Alabama | 33.1 | 1 in 30 |
| 2 | Mobile | Alabama | 27.9 | 1 in 35 |
| 3 | Monroe | Louisiana | 26.3 | 1 in 38 |
| 4 | Saginaw | Michigan | 25.1 | 1 in 39 |
| 5 | Memphis | Tennessee | 25.1 | 1 in 39 |
| 6 | Detroit | Michigan | 23.0 | 1 in 43 |
| 7 | Birmingham | Alabama | 20.6 | 1 in 49 |
| 8 | Pine Bluff | Arkansas | 20.5 | 1 in 48 |
| 9 | Little Rock | Arkansas | 20.2 | 1 in 49 |
| 10 | Alexandria | Louisiana | 18.8 | 1 in 53 |
| 11 | Cleveland | Ohio | 17.1 | 1 in 58 |
| 12 | Kalamazoo | Michigan | 16.8 | 1 in 59 |
| 13 | Milwaukee | Wisconsin | 16.6 | 1 in 59 |
| 14 | Albany | Georgia | 16.1 | 1 in 61 |
| 15 | Gadsden | Alabama | 15.8 | 1 in 63 |
| 16 | Danville | Illinois | 15.8 | 1 in 63 |
| 17 | Lansing | Michigan | 15.7 | 1 in 63 |
| 18 | Baltimore | Maryland | 15.6 | 1 in 63 |
| 19 | Springfield | Missouri | 15.6 | 1 in 64 |
| 20 | Spartanburg | South Carolina | 15.2 | 1 in 65 |
| 21 | Rockford | Illinois | 15.0 | 1 in 66 |
| 22 | Wilmington | Delaware | 15.0 | 1 in 66 |
| 23 | St. Louis | Missouri | 14.9 | 1 in 66 |
| 24 | San Bernardino | California | 14.9 | 1 in 67 |
| 25 | Kansas City | Missouri | 14.5 | 1 in 68 |
| 26 | Canton | Ohio | 14.5 | 1 in 68 |
| 27 | Chester | Pennsyvlania | 14.5 | 1 in 68 |
| 28 | South Bend | Indiana | 14.4 | 1 in 69 |
| 29 | Inkster | Michigan | 14.1 | 1 in 70 |
| 30 | Albuquerque | New Mexico | 13.9 | 1 in 71 |
| 31 | Chattanooga | Tennessee | 13.9 | 1 in 71 |
| 32 | Terre Haute | Indiana | 13.9 | 1 in 71 |
| 33 | New Orleans | Louisiana | 13.8 | 1 in 72 |
| 34 | Camden | New Jersey | 13.7 | 1 in 72 |
| 35 | East Point | Georgia | 13.6 | 1 in 73 |
| 36 | Minneapolis | Minnesota | 13.4 | 1 in 74 |
| 37 | Florence | South Carolina | 13.1 | 1 in 75 |
| 38 | Elkhart | Indiana | 12.8 | 1 in 77 |
| 39 | Pueblo | Colorado | 12.6 | 1 in 79 |
| 40 | Stockton | California | 12.5 | 1 in 79 |
| 41 | Oakland | California | 12.5 | 1 in 79 |
| 42 | Flint | Michigan | 12.5 | 1 in 79 |
| 43 | Houston | Texas | 12.4 | 1 in 80 |
| 44 | Jacksonville | Arkansas | 12.1 | 1 in 82 |
| 45 | Myrtle Beach | South Carolina | 12.1 | 1 in 82 |
| 46 | Paragould | Arkansas | 12.1 | 1 in 82 |
| 47 | Battle Creek | Michigan | 12.0 | 1 in 82 |
| 48 | Tacoma | Washington | 11.9 | 1 in 83 |
| 49 | Baton Rouge | Louisiana | 11.9 | 1 in 83 |
| 50 | Jackson | Michigan | 11.8 | 1 in 84 |
| 51 | North Little Rock | Arkansas | 11.9 | 1 in 84 |
| 52 | Nashville | Tennessee | 11.8 | 1 in 84 |
| 53 | Pontiac | Michigan | 11.7 | 1 in 85 |
| 54 | Wichita | Kansas | 11.7 | 1 in 85 |
| 55 | Newnan | Georgia | 11.7 | 1 in 85 |
| 56 | Compton | California | 11.7 | 1 in 85 |
| 57 | Riviera Beach | Florida | 11.5 | 1 in 86 |
| 58 | Winston-Salem | North Carolina | 11.4 | 1 in 87 |
| 59 | Anchorage | Alaska | 11.4 | 1 in 87 |
| 60 | Statesville | North Carolina | 11.2 | 1 in 89 |
| 61 | Fort Smith | Arkansas | 11.1 | 1 in 89 |
| 62 | Springfield | Ohio | 11.0 | 1 in 90 |
| 63 | Palm Springs | Florida | 10.9 | 1 in 91 |
| 64 | Beaumont | Texas | 10.8 | 1 in 91 |
| 65 | East Chicago | Indiana | 10.8 | 1 in 91 |
| 66 | Tulsa | Oklahoma | 10.8 | 1 in 91 |
| 67 | Lubbock | Texas | 10.8 | 1 in 92 |
| 68 | Toledo | Ohio | 10.8 | 1 in 92 |
| 69 | York | Pennsyvlania | 10.8 | 1 in 92 |
| 70 | Barstow | California | 10.7 | 1 in 92 |
| 71 | Farmington | New Mexico | 10.7 | 1 in 93 |
| 72 | Dayton | Ohio | 10.5 | 1 in 95 |
| 73 | Bossier City | Louisiana | 10.4 | 1 in 95 |
| 74 | North Charleston | South Carolina | 10.4 | 1 in 95 |
| 75 | Aurora | Colorado | 10.1 | 1 in 98 |
| 76 | Daytona Beach | Florida | 10.1 | 1 in 98 |
| 77 | South Salt Lake | Utah | 9.9 | 1 in 100 |
| 78 | Salt Lake City | Utah | 9.9 | 1 in 100 |
| 79 | Billings | Montana | 9.9 | 1 in 100 |
| 80 | Washington, DC | Washington, DC | 9.8 | 1 in 101 |
| 81 | Grand Rapids | Michigan | 9.8 | 1 in 101 |
| 82 | Louisville | Kentucky | 9.7 | 1 in 102 |
| 83 | Fayetteville | North Carolina | 9.7 | 1 in 103 |
| 84 | Huntsville | Alabama | 9.7 | 1 in 103 |
| 85 | Denver | Colorado | 9.7 | 1 in 103 |
| 86 | Goldsboro | North Carolina | 9.6 | 1 in 103 |
| 87 | Holyoke | Massachusetts | 9.6 | 1 in 103 |
| 88 | Wheeling | West Virginia | 9.6 | 1 in 103 |
| 89 | Vallejo | California | 9.6 | 1 in 103 |
| 90 | Shreveport | Louisiana | 9.6 | 1 in 103 |
| 91 | Muskogee | Oklahoma | 9.6 | 1 in 103 |
| 92 | Panama City | Florida | 9.5 | 1 in 104 |
| 93 | Dover | Delaware | 9.5 | 1 in 105 |
| 94 | Atlanta | Georgia | 9.5 | 1 in 105 |
| 95 | Jackson | Tennessee | 9.5 | 1 in 105 |
| 96 | Texarkana | Arkansas | 9.4 | 1 in 105 |
| 97 | Lake Worth Beach | Florida | 9.3 | 1 in 106 |
| 98 | Chamblee | Georgia | 9.3 | 1 in 106 |
| 99 | Springfield | Massachusetts | 9.3 | 1 in 106 |
| 100 | Rocky Mount | North Carolina | 9.3 | 1 in 107 |
Both large cities and smaller ones make the list, with Memphis and Detroit the biggest cities to appear in the top 10 with populations above 600,000. A person’s chance of being a victim of violent crime in each is 1-in-39 and 1-in-43, respectively.
It’s worth noting that the numbers above are strictly for the most violent forms of crime, and don’t include things like simple assault and various forms of property crime. These push the total crime rate, and therefore the likelihood of becoming a victim of any crime, much higher in these hotspots.
And though there are well-known cities in the list, a few typically associated with crime don’t make even the top 100. For instance, New York City’s violent crime rate is 5.2 per 1,000 residents, with the chance of being a victim in Manhattan specifically at 1-in-192.
Crime in the United States
The violent crime rate for the entire U.S. is 5.6 per 1,000 people. Comparatively, the safest cities in the us have total crime rates of 8.6 per 1,000 people and lower.
It’s difficult to touch on violent crime in the U.S. without discussing gun violence. According to the Gun Violence Archive, there have already been more than 22,000 gun violence deaths in the U.S. as of July 2023. That includes 371 mass shootings, and 150 children deaths.
And though the latest annual FBI data shows that violent crime has decreased from 2020 to 2021, murders have gone up over the same time frame.
Source: NeighborhoodScout, using data from the FBI, and the U.S. Census Bureau.
Data notes: The source only considered cities with a population of 25,000 or higher. Violent crimes includes reported armed robbery, murder, rape, and aggravated assault.

-

 Markets2 weeks ago
Visualizing 1 Billion Square Feet of Empty Office Space
-
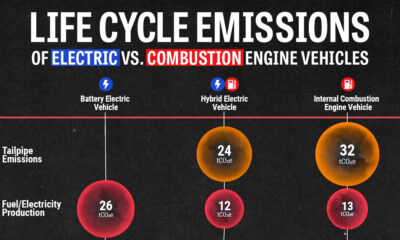
 Energy4 weeks ago
Life Cycle Emissions: EVs vs. Combustion Engine Vehicles
-

 Maps2 weeks ago
Vintage Viz: The World’s Rivers and Lakes, Organized Neatly
-
 Finance3 weeks ago
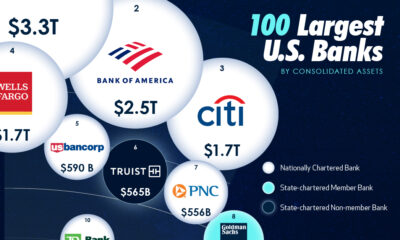
Visualized: The 100 Largest U.S. Banks by Consolidated Assets
-

 Automation1 week ago
Charted: Changing Sentiments Towards AI in the Workplace
-

 VC+3 weeks ago
What are Top Investment Managers Holding in Their Portfolios?
-

 Stocks1 week ago
The 50 Best One-Year Returns on the S&P 500 (1980-2022)
-

 United States3 weeks ago
Chart: U.S. Home Price Growth Over 50 Years