Energy
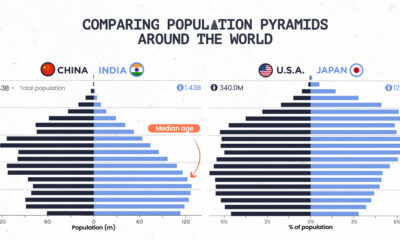
Who’s Still Buying Russian Fossil Fuels in 2023?
![]() Subscribe to the Elements free mailing list for more like this
Subscribe to the Elements free mailing list for more like this
The Countries Buying Fossil Fuels from Russia in 2023
This was originally posted on Elements. Sign up to the free mailing list to get beautiful visualizations on real assets and resource megatrends each week.
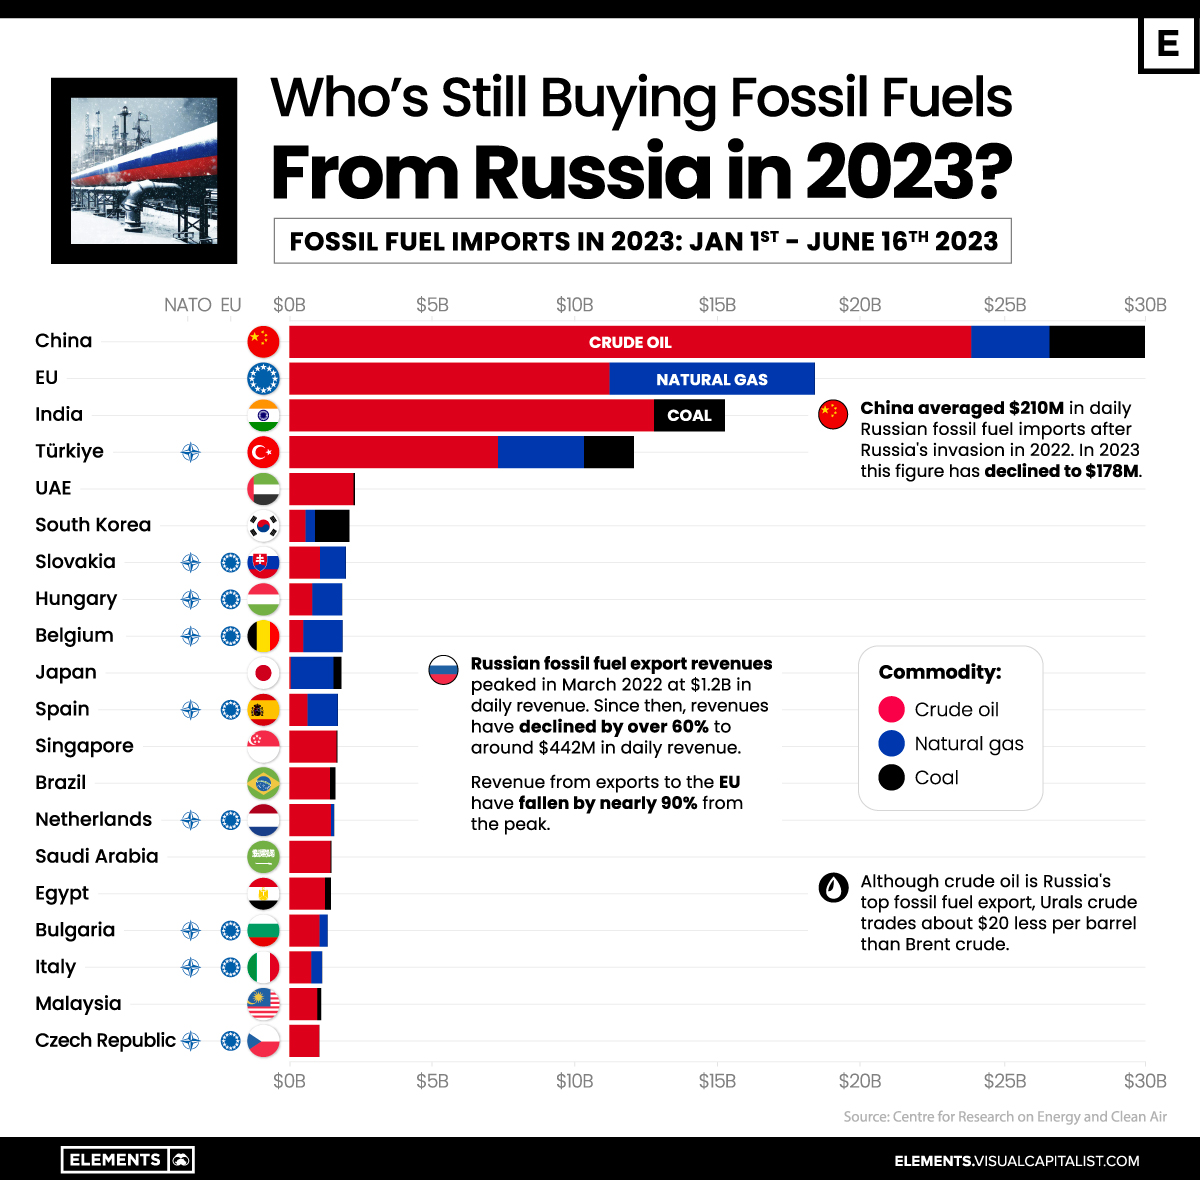
While Russia’s revenues from fossil fuel exports have declined significantly since their peak in March of 2022, many countries are still importing millions of dollars a day worth of fossil fuels from Russia.
Revenue from fossil fuels exported to the EU has declined more than 90% from their peak, but in 2023 the bloc has still imported more than $18 billion of crude oil and natural gas so far.
This graphic uses data from the Centre for Research on Energy and Clean Air (CREA) to visualize the top-importing countries of fossil fuels from Russia so far this year.
China Remains Russia’s Top Fossil Fuel Importer
China continues to be Russia’s top buyer of fossil fuels, with imports reaching $30 billion in 2023 up until June 16, 2023.
With nearly 80% of China’s fuel imports being crude oil, Russia’s average daily revenues from Chinese fossil fuel imports have declined from $210 million in 2022 to $178 million in 2023 largely due to the falling price of Russian crude oil.
Following China are EU nations collectively, which despite no longer importing coal from Russia since August of 2022, still imported $18.4 billion of fossil fuels in a 60/40 split of crude oil and natural gas respectively.
| Country | Russian Fossil Fuel Imports* (Total) | Crude Oil | Natural Gas | Coal | |||||||||
|---|---|---|---|---|---|---|---|---|---|---|---|---|---|
| 🇨🇳 China | $30B | $23.9B | $2.7B | $3.3B | |||||||||
| 🇪🇺 EU | $18.4B | $11.2B | $7.2B | $0 | |||||||||
| 🇮🇳 India | $15.2B | $12.8B | $0 | $2.5B | |||||||||
| 🇹🇷 Türkiye | $12.1B | $7.3B | $3B | $1.7B | |||||||||
| 🇦🇪 UAE | $2.3B | $2.3B | $0 | $0 | |||||||||
| 🇰🇷 South Korea | $2.1B | $0.6B | $0.3B | $1.2B | |||||||||
| 🇸🇰 Slovakia | $2.0B | $1.1B | $0.9B | $0 | |||||||||
| 🇭🇺 Hungary | $1.9B | $0.8B | $1.1B | $0 | |||||||||
| 🇧🇪 Belgium | $1.9B | $0.5B | $1.4B | $0 | |||||||||
| 🇯🇵 Japan | $1.8B | $0 | $1.5B | $0.3B | |||||||||
| 🇪🇸 Spain | $1.7B | $0.6B | $1.1B | $0 | |||||||||
| 🇸🇬 Singapore | $1.7B | $1.7B | $0 | $0 | |||||||||
| 🇧🇷 Brazil | $1.6B | $1.4B | $0 | $0.2B | |||||||||
| 🇳🇱 Netherlands | $1.6B | $1.5B | $0.1B | $0 | |||||||||
| 🇸🇦 Saudi Arabia | $1.5B | $1.4B | $0 | $0 | |||||||||
| 🇪🇬 Egypt | $1.4B | $1.3B | $0 | $0.2B | |||||||||
| 🇧🇬 Bulgaria | $1.3B | $1.1B | $0.3B | $0 | |||||||||
| 🇮🇹 Italy | $1.2B | $0.8B | $0.4B | $0 | |||||||||
| 🇲🇾 Malaysia | $1.1B | $1.0B | $0 | $0.1B | |||||||||
| 🇨🇿 Czech Republic | $1.0B | $1.1B | $0 | $0 |
*Over the time period of Jan 1, 2023 to June 16, 2023 in U.S. dollars
After China and the EU bloc, India is the next-largest importer of Russian fossil fuels, having ramped up the amount of fossil fuels imported by more than 10x since before Russia’s invasion of Ukraine, largely due to discounted Russian oil.
Türkiye is the only other nation to have imported more than $10 billion worth of Russian fossil fuels in 2023, with every other country having imported fewer than $3 billion worth of fuels from Russia this year.
Navigating the Crude Reality of Oil Exports
Although crude oil is Russia’s chief fossil fuel export, the nation’s Urals crude traded at a $20 per barrel discount to Brent crude throughout most of 2023. While this discount has narrowed to around $16 following Russia’s announcement of further oil export cuts of 500,000 bpd (barrels per day), the price of Urals crude oil remains just 40 cents below the $60 price cap put in place by G7 and EU nations.
Alongside Russia, Saudi Arabia also announced it would extend its cut of 1 million bpd until the end of August, with Saudi Energy Minister Prince Abdulaziz bin Salman commenting on the country’s solidarity with Russia and saying it would do “whatever is necessary” to support the oil market.
While OPEC and OPEC+ nations’ cuts are an attempt at pushing crude oil prices up, increased production from the U.S. has counteracted this. The EIA forecasts 2023 U.S. production to be 12.6 million bpd, surpassing the high in 2019 of 12.3 million bpd.


Batteries
Visualized: The Rise of the LFP Battery
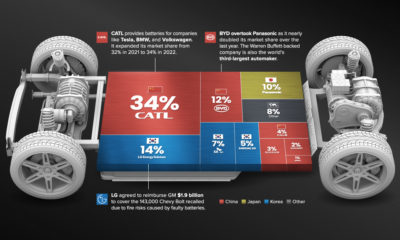
In 2022, the EV sector’s market share of the LFP battery rose from just 6% in 2020 to 30%, highlighting its growing popularity.


The Rise of the LFP Battery
Primarily a key component in fertilizers, phosphate is also essential to lithium iron phosphate (LFP) battery technology.
LFP is an emerging favorite in the expanding EV market, particularly in standard-range EVs. Factors driving this popularity include superior safety, longevity, cost-effectiveness, and environmental sustainability.
In this graphic, our sponsor First Phosphate looks at the growing LFP market, highlighting forecasted growth and current market share.
Market Growth
In 2022, the global LFP battery market stood at $12.5 billion. By 2030, this figure is expected to catapult to nearly $52.7 billion, signifying a CAGR of 19.7%.
| Year | USD (Billion) |
|---|---|
| 2021 | $10.5B |
| 2022 | $12.5B |
| 2023F | $15.0B |
| 2024F | $17.9B |
| 2025F | $21.5B |
| 2026F | $25.7B |
| 2027F | $30.7B |
| 2028F | $36.8B |
| 2029F | $44.0B |
| 2030F | $52.7B |
In 2022, LFP batteries cornered a sizable 30% of the EV market share from just 6% in 2020, demonstrating the growing appeal of this type of lithium-ion battery in the electric vehicle sector.
Market Share
The Asia Pacific region dominated the LFP battery market in 2021, accounting for over 34% of the global share.
| Regions | Revenue Share (%) |
|---|---|
| Asia Pacific | 34% |
| North America | 29% |
| Europe | 23% |
| Latin America | 10% |
| MEA | 4% |
Meanwhile, North America, with the second largest share, is projected to witness ongoing growth through 2030.
First Phosphate holds access to 1% of the world’s purest igneous rock phosphate reserves in Québec, making it an ideal supplier for the growing LFP market.

-

 Batteries2 months ago
Mapped: Renewable Energy and Battery Installations in the U.S. in 2023
This graphic describes new U.S. renewable energy installations by state along with nameplate capacity, planned to come online in 2023.
-
 Energy2 months ago
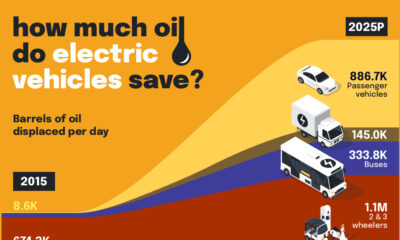
How EV Adoption Will Impact Oil Consumption (2015-2025P)
How much oil is saved by adding electric vehicles into the mix? We look at data from 2015 to 2025P for different types of EVs.
-

 Energy3 months ago
Global EV Production: BYD Surpasses Tesla
This graphic explores the latest EV production data for 2022, which shows BYD taking a massive step forward to surpass Tesla.
-
 Batteries6 months ago
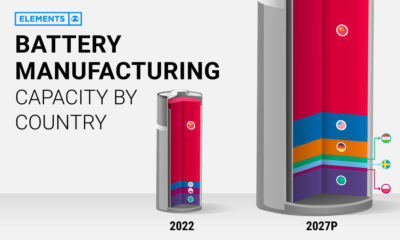
Visualizing China’s Dominance in Battery Manufacturing (2022-2027P)
This infographic breaks down battery manufacturing capacity by country in 2022 and 2027.
-

 Energy7 months ago
Visualizing 25 Years of Lithium Production, by Country
Lithium production has grown exponentially over the last few decades. Which countries produce the most lithium, and how how has this mix evolved?
-
 Energy10 months ago
The Top 10 EV Battery Manufacturers in 2022
Despite efforts from the U.S. and Europe to increase the domestic production of batteries, the market is still dominated by Asian suppliers.

-

 VC+4 days ago
What’s New on VC+ in July
-

 Datastream4 weeks ago
Can You Calculate Your Daily Carbon Footprint?
-

 apps2 weeks ago
Meet the Competing Apps Battling for Twitter’s Market Share
-
 Politics17 hours ago
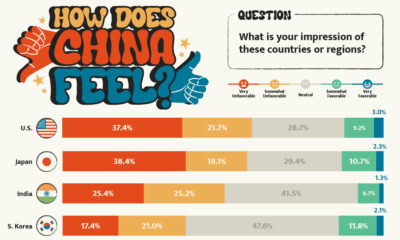
How Do Chinese Citizens Feel About Other Countries?
-

 Investor Education4 weeks ago
Visualizing BlackRock’s Top Equity Holdings
-

 Markets2 weeks ago
Visualizing 1 Billion Square Feet of Empty Office Space
-

 Markets4 weeks ago
Visualizing Every Company on the S&P 500 Index
-
 Maps2 weeks ago
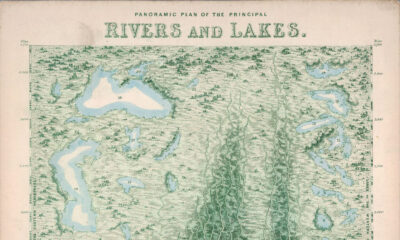
Vintage Viz: The World’s Rivers and Lakes, Organized Neatly