Maps
Vintage Viz: The World’s Rivers and Lakes, Organized Neatly
Vintage Viz: The World’s Rivers and Lakes, Organized Neatly
Rivers and lakes have borne witness to many of humanity’s greatest moments.
In the first century BCE, the Rubicon not only marked the border between the Roman provinces of Gaul and Italia, but also the threshold for civil war. From the shores of Lake Van in 1071, you could witness the Battle of Manzikert and the beginning of the end for the Byzantine Empire.
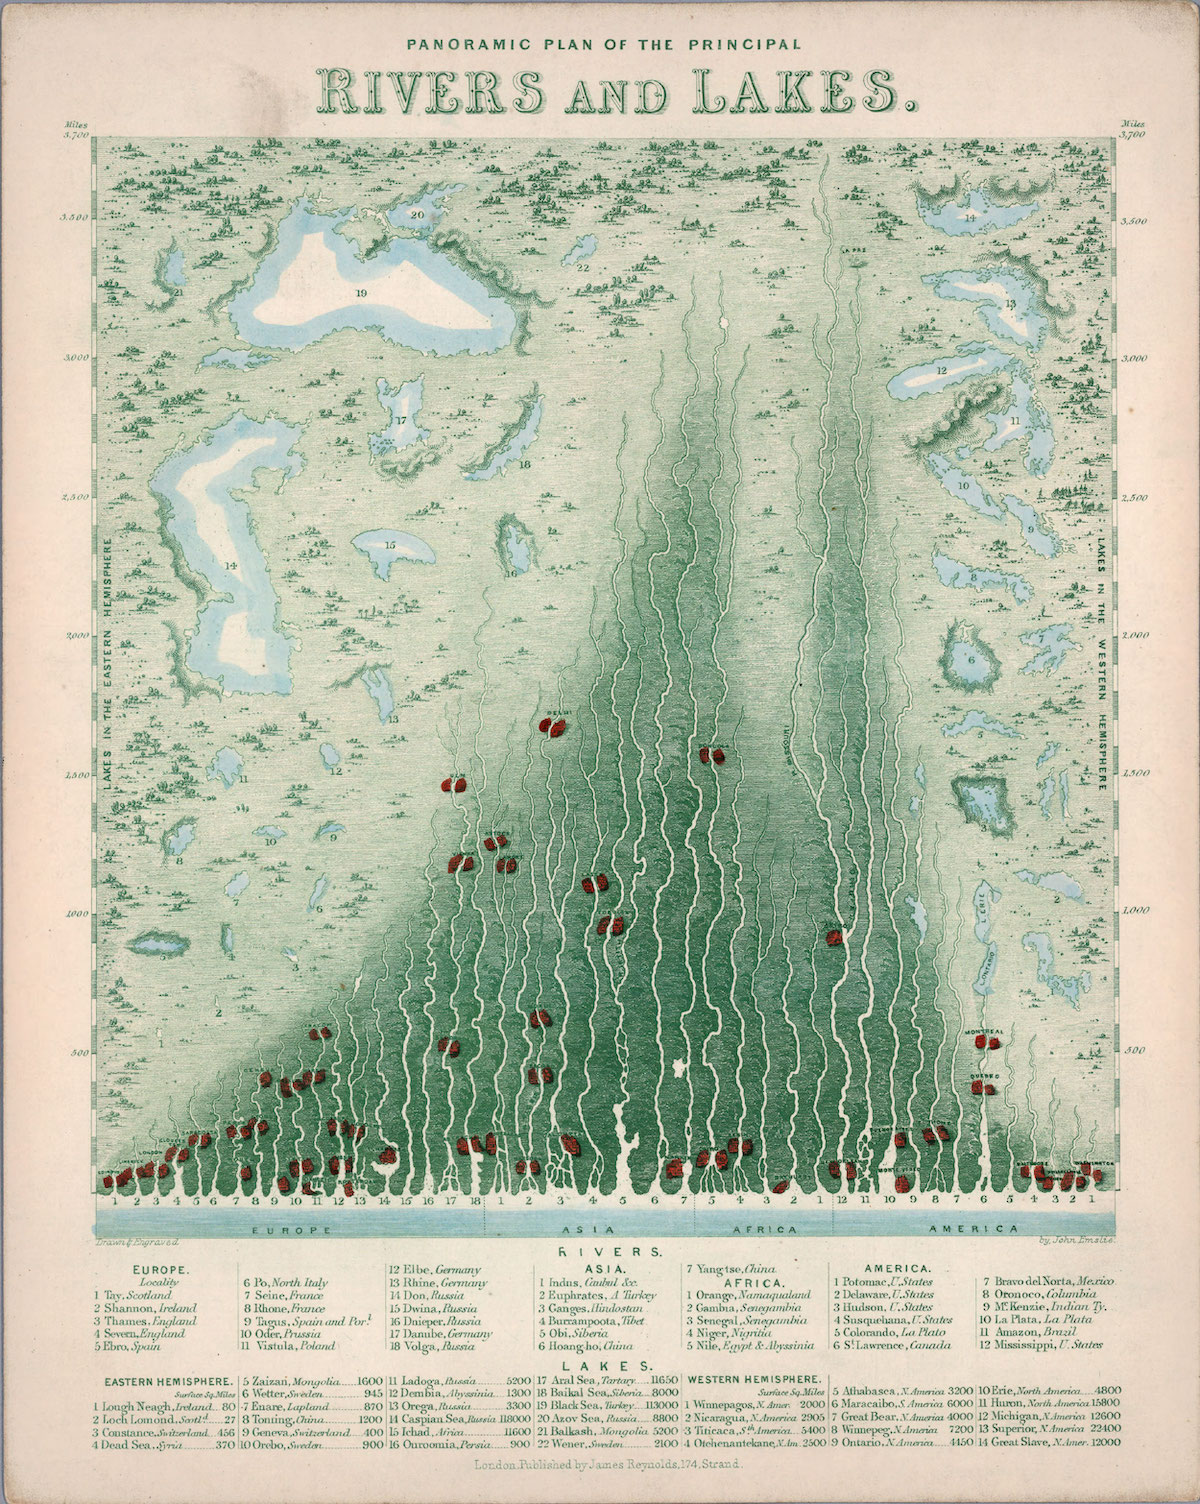
Rivers carry our trade, our dead, and even our prayers, so when London mapmaker James Reynolds partnered with engraver John Emslie to publish the Panoramic Plan of the Principal Rivers and Lakes in 1850, he could be sure of a warm reception.
The visualization, the latest in our Vintage Viz series, beautifully illustrates 42 principal rivers in Europe, Asia, Africa, and the Americas, along with 36 lakes across the Eastern and Western hemispheres. Each river has been unraveled and straightened onto an imaginary landscape-–no meandering here—and arranged by size. Major cities are marked by a deep orangy-red.
Top 3 Longest Principal Rivers (in 1850)
According to this visualization, the Mighty Mississippi is among the world’s longest, coming in at 3,650 miles, followed by the Amazon, the Nile, and the Yangtze river in China. The bottom three are the Tay in Scotland (125 miles), the Shannon in Ireland (200 miles), and the Potomac in the U.S. (275 miles).
Surveying methods have come a long way since 1850, and we now have satellites, GPS, and lasers, so we can update these rankings. According to the CIA World Factbook, the Nile (6,650 km / 4,132 miles), the Amazon (6,436 km / 3,998 miles), and the Yangtze (6,300 km / 3,915 miles) are the world’s top three longest rivers.
The table below shows the rivers in the graphic above compared with today’s measurements, as well as the general location of rivers using 1850 location names (including modern day locations in brackets).
| River | Territory | Viz length (miles) | Modern length (miles) |
|---|---|---|---|
| Mississippi | United States | 3,650 | 2,340 |
| Amazon | Brazil | 3,350 | 3,998 |
| Nile | Egypt and Abyssinia (Ethiopia) | 3,325 | 4,132 |
| Yangtse | China | 3,300 | 3,915 |
| Hoang-ho | China | 3,025 | 3,395 |
| Obi | Siberia | 2,800 | 2,268 |
| La Plata | La Plata (Argentina/Uruguay) | 2,450 | 3,030 |
| Volga | Russia | 2,200 | 2,193 |
| Burrampoota | Tibet | 2,200 | 1,800 |
| Ganges | Hindostan (India) | 1,975 | 1,569 |
| Euphrates | A(siatic) Turkey | 1,850 | 1,740 |
| Danube | Germany | 1,800 | 1,770 |
| Niger | Nigeria | 1,750 | 2,600 |
| Indus | Caubul etc (Afghanistan etc) | 1,700 | 1,988 |
| McKenzie | Indian Territory (Canada) | 1,600 | 1,080 |
| Senegal | Senegambia (Senegal) | 1,450 | 1,020 |
| Dnieper | Russia | 1,375 | 1,367 |
| Oronoco | Gran Colombia (Venezuela) | 1,325 | 1,700 |
| Gambia | Senegambia (The Gambia) | 1,300 | 740 |
| Bravo del Norta (Rio Grande) | Mexico | 1,150 | 1,900 |
| St. Lawrence | Canada | 1,125 | 1,900 |
| Orange | Namaqualand (Namibia/South Africa) | 1,100 | 1,367 |
| Dwina | Russia | 1,000 | 1,020 |
| Don | Russia | 975 | 1,198 |
| Rhine | Germany | 850 | 766 |
| Elbe | Germany | 750 | 724 |
| Vistula | Poland | 650 | 651 |
| Oder | Prussia (Germany) | 625 | 529 |
| Colorando | La Plato (United States) | 600 | 1,450 |
| Tague | Spain and Portugal | 575 | 626 |
| Susquehana | United States | 575 | 464 |
| Rhone | France | 550 | 505 |
| Seine | France | 475 | 485 |
| Po | North Italy | 450 | 405 |
| Hudson | United States | 425 | 315 |
| Ebro | Spain | 400 | 565 |
| Severn | England | 350 | 220 |
| Delaware | United States | 325 | 301 |
| Potomac | United States | 275 | 405 |
| Thames | England | 275 | 215 |
| Shannon | Ireland | 200 | 224 |
| Tay | Scotland | 125 | 117 |
These figures are a unique look into a time period where humanity’s efforts to quantify the world were still very much a work in progress.
Editor’s note: Some of the rivers and lakes are spelled slightly differently in 1850 than they are today. For example, the map notes today’s Mackenzie River (Canada) as the McKenzie River, and the Yangtze River (China) as the Yangtse.
O Say, Can You Sea?
The largest ‘lake’ in this visualization is the Caspian Sea (118,000 sq. miles), followed by the Black Sea (113,000 sq. miles), and the greatest of the Great Lakes, Lake Superior (22,400 sq. miles). While the Caspian Sea is considered a saltwater lake and could reasonably have a place here, the Black Sea—possibly bearing that name because of the color black’s association with “north”—is not a lake by any stretch of the imagination.
And while many of the surface areas reported could also be updated with modern estimates, the story behind Lake Chad (called Ichad in the visualization), the Aral Sea, and the Dead Sea are altogether different. Human development, unsustainable water use, and climate change have led to dramatic drops in water levels.
The Dead Sea in particular had a surface area of 405 sq. miles (1,050 km2) in 1930, but has since dropped to 234 sq. miles (606.1 km2) in 2016.
| Lake | Territory | Viz surface area (sq. miles) | Modern surface area (sq. miles) |
|---|---|---|---|
| Caspian Sea | Russia | 118,000 | 143,000 |
| Black Sea | Turkey | 113,000 | 168,500 |
| Superior | North America | 22,400 | 31,700 |
| Huron | North America | 15,800 | 23,007 |
| Michigan | North America | 12,600 | 22,404 |
| Great Slave | North America | 12,000 | 10,500 |
| Aral Sea | Tartary (Central Eurasia) | 11,650 | 6,900 |
| Ichad | Africa | 11,600 | 590 |
| Azov | Russia | 8,800 | 14,500 |
| Baikal Sea | Siberia | 8,000 | 12,248 |
| Winnepeg | North America | 7,200 | 9,416 |
| Maracaibo | South America | 6,000 | 5,130 |
| Titicaca | South America | 5,400 | 3,030 |
| Ladoga | Russia | 5,200 | 6,700 |
| Balkash | Mongolia | 5,200 | 7,000 |
| Erie | North America | 4,800 | 9,910 |
| Ontario | North America | 4,450 | 7,340 |
| Great Bear | North America | 4,000 | 12,028 |
| Orega | Russia | 3,300 | 3,700 |
| Athabasca | North America | 3,200 | 3,030 |
| Nicaragua | North America | 2,905 | 3,149 |
| Otehenantekane | North America | 2,500 | 2,500 |
| Wener | Sweden | 2,100 | 2,181 |
| Winnepagos | North America | 2,000 | 2,070 |
| Zaizan | Mongolia | 1,600 | 700 |
| Dembia | Abyssinia (Ethiopia) | 1,300 | 1,418 |
| Tonting | China | 1,200 | 1,090 |
| Wetter | Sweden | 945 | 738 |
| Orebo | Sweden | 900 | 186 |
| Ouroomia | Persia | 900 | 1,126 |
| Enare | Lapland (Finland) | 870 | 1,040 |
| Constance | Scotland | 456 | 209 |
| Geneva | Swtizerland | 400 | 224 |
| Dead Sea | Syria | 370 | 605 |
| Lough Neagh | Ireland | 80 | 153 |
| Loch Lomond | Scotland | 27 | 27 |
You Can’t Step in the Same River Twice
Over time, natural and anthropogenic forces cause rivers to change their course, and lakes to shift their banks. If Reynolds and Emslie were alive today to update this visualization, it would likely look quite different, as would one made 100 years from now. But so goes the river of time.


Agriculture
Mapped: Meat Consumption By Country and Type
By examining meat consumption by country, we uncover regional differences in how much, and what type of meat people around the world prefer.
 Creator Program
Mapped: Meat Consumption By Country and Type
Meat is always on the menu in many parts of the world, as we can see when we map out meat consumption by country.
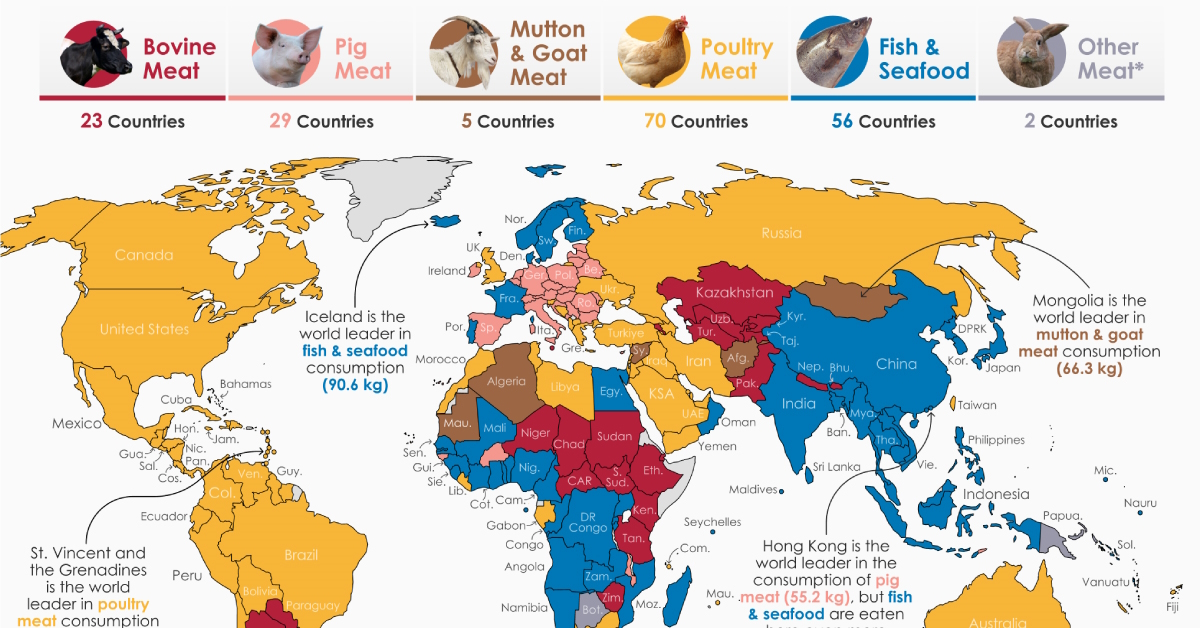
How do countries differ in how much, and what type of meat, they eat? In this colorful graphic, our creator theWORLDMAPS highlights the most consumed type of meat in every country in the world, using data from the UN’s Food and Agriculture Organization (FAO).
Each color denotes a different category of meat—beef, pork, mutton, poultry, seafood, or other—with annual consumption calculated per capita in kilograms (kg).
Let’s dig in to the data.
Is Fish Considered Meat?
Since meat is normally defined as the flesh of any animal (with the primary components being water, fat, and protein), that includes fish and other seafood.
But whether fish is considered “meat” or not depends a lot on cultural practices and dietary preferences, and has varied throughout history. Some earlier definitions of meat focused only on mammals, for example.
In Christianity for example, many denominations allow eating fish on fasting days when abstaining from meat. This was both due to distinctions between meat from warm-blooded land animals and cold-blooded animals (like fish), as well as the importance of fish consumption in parts of Europe where Christianity flourished.
To account for both sides of the debate, we’ll cover meat consumption by country both with and without fish and seafood.
The Most Consumed Meat by Country (Including Seafood)
Just by glancing at the map and the below table, poultry stands out as the most popular meat by weight consumption in 70 countries, or about 40% of the entire database.
Note: Other meat includes less frequently farmed animals like rabbit, horse, and camel, as well as game—meat from wild animals.
| Country | Most Consumed Meat |
|---|---|
| 🇦🇫 Afghanistan | Mutton & Goat |
| 🇦🇱 Albania | Poultry |
| 🇩🇿 Algeria | Mutton & Goat |
| 🇦🇴 Angola | Fish & Seafood |
| 🇦🇬 Antigua & Barbuda | Poultry |
| 🇦🇷 Argentina | Bovine |
| 🇦🇲 Armenia | Bovine |
| 🇦🇺 Australia | Poultry |
| 🇦🇹 Austria | Pork |
| 🇦🇿 Azerbaijan | Poultry |
| 🇧🇸 Bahamas | Poultry |
| 🇧🇭 Bahrain | Poultry |
| 🇧🇩 Bangladesh | Fish & Seafood |
| 🇧🇧 Barbados | Poultry |
| 🇧🇾 Belarus | Pork |
| 🇧🇪 Belgium | Pork |
| 🇧🇿 Belize | Poultry |
| 🇧🇯 Benin | Fish & Seafood |
| 🇧🇹 Bhutan | Bovine |
| 🇧🇴 Bolivia | Poultry |
| 🇧🇦 Bosnia & Herzegovina | Poultry |
| 🇧🇼 Botswana | Other |
| 🇧🇷 Brazil | Poultry |
| 🇧🇬 Bulgaria | Pork |
| 🇧🇫 Burkina Faso | Pork |
| 🇧🇮 Burundi | Fish & Seafood |
| 🇨🇻 Cabo Verde | Poultry |
| 🇰🇭 Cambodia | Fish & Seafood |
| 🇨🇲 Cameroon | Fish & Seafood |
| 🇨🇦 Canada | Poultry |
| 🇨🇫 Central African Republic | Bovine |
| 🇹🇩 Chad | Bovine |
| 🇨🇱 Chile | Poultry |
| 🇨🇳 China | Fish & Seafood |
| 🇨🇴 Colombia | Poultry |
| 🇰🇲 Comoros | Poultry |
| 🇨🇬 Congo | Fish & Seafood |
| 🇨🇷 Costa Rica | Poultry |
| 🇨🇮 Côte d’Ivoire | Fish & Seafood |
| 🇭🇷 Croatia | Pork |
| 🇨🇺 Cuba | Poultry |
| 🇨🇾 Cyprus | Pork |
| 🇨🇿 Czechia | Pork |
| 🇩🇰 Denmark | Fish & Seafood |
| 🇩🇯 Djibouti | Bovine |
| 🇩🇲 Dominica | Poultry |
| 🇩🇴 Dominican Republic | Poultry |
| 🇨🇩 DR Congo | Fish & Seafood |
| 🇪🇨 Ecuador | Poultry |
| 🇪🇬 Egypt | Fish & Seafood |
| 🇸🇻 El Salvador | Poultry |
| 🇪🇪 Estonia | Pork |
| 🇸🇿 Eswatini | Bovine |
| 🇪🇹 Ethiopia | Bovine |
| 🇫🇯 Fiji | Poultry |
| 🇫🇮 Finland | Fish & Seafood |
| 🇫🇷 France | Fish & Seafood |
| 🇵🇫 French Polynesia | Poultry |
| 🇬🇦 Gabon | Poultry |
| 🇬🇲 Gambia | Fish & Seafood |
| 🇬🇪 Georgia | Poultry |
| 🇩🇪 Germany | Pork |
| 🇬🇭 Ghana | Fish & Seafood |
| 🇬🇷 Greece | Poultry |
| 🇬🇩 Grenada | Poultry |
| 🇬🇹 Guatemala | Poultry |
| 🇬🇳 Guinea | Fish & Seafood |
| 🇬🇼 Guinea-Bissau | Pork |
| 🇬🇾 Guyana | Poultry |
| 🇭🇹 Haiti | Poultry |
| 🇭🇳 Honduras | Poultry |
| 🇭🇰 Hong Kong | Fish & Seafood |
| 🇭🇺 Hungary | Pork |
| 🇮🇸 Iceland | Fish & Seafood |
| 🇮🇳 India | Fish & Seafood |
| 🇮🇩 Indonesia | Fish & Seafood |
| 🇮🇷 Iran | Poultry |
| 🇮🇶 Iraq | Poultry |
| 🇮🇪 Ireland | Pork |
| 🇮🇱 Israel | Poultry |
| 🇮🇹 Italy | Pork |
| 🇯🇲 Jamaica | Poultry |
| 🇯🇵 Japan | Fish & Seafood |
| 🇯🇴 Jordan | Poultry |
| 🇰🇿 Kazakhstan | Bovine |
| 🇰🇪 Kenya | Bovine |
| 🇰🇮 Kiribati | Fish & Seafood |
| 🇰🇼 Kuwait | Poultry |
| 🇰🇬 Kyrgyzstan | Bovine |
| 🇱🇦 Laos | Fish & Seafood |
| 🇱🇻 Latvia | Pork |
| 🇱🇧 Lebanon | Poultry |
| 🇱🇸 Lesotho | Pork |
| 🇱🇷 Liberia | Poultry |
| 🇱🇾 Libya | Poultry |
| 🇱🇹 Lithuania | Pork |
| 🇱🇺 Luxembourg | Pork |
| 🇲🇴 Macao | Fish & Seafood |
| 🇲🇬 Madagascar | Fish & Seafood |
| 🇲🇼 Malawi | Pork |
| 🇲🇾 Malaysia | Fish & Seafood |
| 🇲🇻 Maldives | Fish & Seafood |
| 🇲🇱 Mali | Fish & Seafood |
| 🇲🇹 Malta | Bovine |
| 🇲🇷 Mauritania | Mutton & Goat |
| 🇲🇺 Mauritius | Poultry |
| 🇲🇽 Mexico | Poultry |
| 🇫🇲 Micronesia | Fish & Seafood |
| 🇲🇩 Moldova | Pork |
| 🇲🇳 Mongolia | Mutton & Goat |
| 🇲🇪 Montenegro | Pork |
| 🇲🇦 Morocco | Poultry |
| 🇲🇿 Mozambique | Fish & Seafood |
| 🇲🇲 Myanmar | Fish & Seafood |
| 🇳🇦 Namibia | Fish & Seafood |
| 🇳🇷 Nauru | Fish & Seafood |
| 🇳🇵 Nepal | Bovine |
| 🇳🇱 Netherlands | Pork |
| 🇳🇨 New Caledonia | Poultry |
| 🇳🇿 New Zealand | Fish & Seafood |
| 🇳🇮 Nicaragua | Poultry |
| 🇳🇪 Niger | Bovine |
| 🇳🇬 Nigeria | Fish & Seafood |
| 🇰🇵 North Korea | Fish & Seafood |
| 🇲🇰 North Macedonia | Poultry |
| 🇳🇴 Norway | Fish & Seafood |
| 🇴🇲 Oman | Fish & Seafood |
| 🇵🇰 Pakistan | Bovine |
| 🇵🇦 Panama | Poultry |
| 🇵🇬 Papua New Guinea | Other |
| 🇵🇾 Paraguay | Bovine |
| 🇵🇪 Peru | Poultry |
| 🇵🇭 Philippines | Fish & Seafood |
| 🇵🇱 Poland | Pork |
| 🇵🇹 Portugal | Fish & Seafood |
| 🇶🇦 Qatar | Poultry |
| 🇷🇴 Romania | Pork |
| 🇷🇺 Russia | Poultry |
| 🇷🇼 Rwanda | Fish & Seafood |
| 🇰🇳 Saint Kitts & Nevis | Poultry |
| 🇱🇨 Saint Lucia | Poultry |
| 🇻🇨 Saint Vincent & the Grenadines | Poultry |
| 🇼🇸 Samoa | Poultry |
| 🇸🇹 Sao Tome & Principe | Fish & Seafood |
| 🇸🇦 Saudi Arabia | Poultry |
| 🇸🇳 Senegal | Fish & Seafood |
| 🇷🇸 Serbia | Pork |
| 🇸🇨 Seychelles | Fish & Seafood |
| 🇸🇱 Sierra Leone | Fish & Seafood |
| 🇸🇰 Slovakia | Pork |
| 🇸🇮 Slovenia | Poultry |
| 🇸🇧 Solomon Islands | Fish & Seafood |
| 🇿🇦 South Africa | Poultry |
| 🇰🇷 South Korea | Fish & Seafood |
| 🇸🇸 South Sudan | Bovine |
| 🇪🇸 Spain | Pork |
| 🇱🇰 Sri Lanka | Fish & Seafood |
| 🇸🇩 Sudan | Bovine |
| 🇸🇷 Suriname | Poultry |
| 🇸🇪 Sweden | Fish & Seafood |
| 🇨🇭 Switzerland | Pork |
| 🇸🇾 Syria | Mutton & Goat |
| 🇹🇼 Taiwan | Poultry |
| 🇹🇯 Tajikistan | Bovine |
| 🇹🇿 Tanzania | Bovine |
| 🇹🇭 Thailand | Fish & Seafood |
| 🇹🇱 Timor-Leste | Pork |
| 🇹🇬 Togo | Fish & Seafood |
| 🇹🇹 Trinidad & Tobago | Poultry |
| 🇹🇳 Tunisia | Poultry |
| 🇹🇷 Türkiye | Poultry |
| 🇹🇲 Turkmenistan | Bovine |
| 🇺🇸 U.S. | Poultry |
| 🇦🇪 UAE | Poultry |
| 🇺🇬 Uganda | Fish & Seafood |
| 🇬🇧 UK | Poultry |
| 🇺🇦 Ukraine | Poultry |
| 🇺🇾 Uruguay | Poultry |
| 🇺🇿 Uzbekistan | Bovine |
| 🇻🇺 Vanuatu | Fish & Seafood |
| 🇻🇪 Venezuela | Poultry |
| 🇻🇳 Vietnam | Fish & Seafood |
| 🇾🇪 Yemen | Poultry |
| 🇿🇲 Zambia | Fish & Seafood |
| 🇿🇼 Zimbabwe | Bovine |
Fish & Seafood ranks as the second most popularly consumed meat in 56 countries, most of them with significant coastlines.
Here’s a breakdown of how much of each type of meat is eaten per capita in each country, measured in kilograms.
| Country | Poultry | Pork | Fish & Seafood | Bovine | Mutton & Other |
|---|---|---|---|---|---|
| 🇦🇫 Afghanistan | 1.7 | 0.0 | 0.4 | 3.2 | 4.3 |
| 🇦🇱 Albania | 13.9 | 5.3 | 8.7 | 11.7 | 8.3 |
| 🇩🇿 Algeria | 6.4 | 0.0 | 3.8 | 3.8 | 8.4 |
| 🇦🇴 Angola | 8.4 | 7.0 | 14.1 | 3.4 | 1.1 |
| 🇦🇬 Antigua & Barbuda | 61.8 | 14.3 | 54.1 | 5.0 | 1.0 |
| 🇦🇷 Argentina | 46.2 | 14.4 | 6.8 | 46.9 | 2.6 |
| 🇦🇲 Armenia | 15.3 | 8.1 | 5.5 | 23.9 | 3.6 |
| 🇦🇺 Australia | 48.7 | 24.2 | 24.1 | 37.0 | 11.5 |
| 🇦🇹 Austria | 15.7 | 45.0 | 14.3 | 14.9 | 1.4 |
| 🇦🇿 Azerbaijan | 14.4 | 0.6 | 2.0 | 13.5 | 8.4 |
| 🇧🇸 Bahamas | 54.4 | 23.8 | 24.2 | 5.2 | 1.7 |
| 🇧🇭 Bahrain | 44.0 | 0.8 | 16.3 | 13.7 | 22.2 |
| 🇧🇩 Bangladesh | 1.6 | 0.0 | 26.7 | 1.3 | 1.4 |
| 🇧🇧 Barbados | 49.3 | 12.3 | 42.9 | 8.0 | 3.4 |
| 🇧🇾 Belarus | 32.2 | 39.2 | 11.8 | 18.6 | 0.4 |
| 🇧🇪 Belgium | 12.4 | 32.8 | 22.7 | 14.0 | 2.6 |
| 🇧🇿 Belize | 23.8 | 20.8 | 13.3 | 3.6 | 0.3 |
| 🇧🇯 Benin | 8.7 | 0.7 | 16.2 | 3.6 | 1.5 |
| 🇧🇹 Bhutan | 4.6 | 1.9 | 7.3 | 9.3 | 0.3 |
| 🇧🇴 Bolivia | 40.9 | 9.7 | 2.8 | 21.6 | 4.9 |
| 🇧🇦 Bosnia & Herzegovina | 20.0 | 9.3 | 7.3 | 12.8 | 0.6 |
| 🇧🇼 Botswana | 3.5 | 0.5 | 2.6 | 10.2 | 14.3 |
| 🇧🇷 Brazil | 48.4 | 14.2 | 8.1 | 35.4 | 1.2 |
| 🇧🇬 Bulgaria | 21.5 | 30.0 | 7.4 | 3.5 | 2.0 |
| 🇧🇫 Burkina Faso | 9.5 | 15.2 | 8.9 | 5.3 | 4.3 |
| 🇧🇮 Burundi | 0.6 | 0.9 | 2.6 | 0.9 | 0.8 |
| 🇨🇻 Cabo Verde | 19.4 | 7.3 | 10.8 | 1.7 | 1.9 |
| 🇰🇭 Cambodia | 2.8 | 5.9 | 45.8 | 4.2 | 0.0 |
| 🇨🇲 Cameroon | 3.3 | 1.2 | 19.1 | 3.1 | 4.0 |
| 🇨🇦 Canada | 40.1 | 21.4 | 20.7 | 27.5 | 1.6 |
| 🇨🇫 Central African Republic | 2.6 | 4.1 | 7.4 | 20.8 | 10.4 |
| 🇹🇩 Chad | 0.5 | 0.2 | 6.6 | 27.5 | 18.7 |
| 🇨🇱 Chile | 36.1 | 22.1 | 14.8 | 23.7 | 1.3 |
| 🇨🇳 China | 15.6 | 35.5 | 39.9 | 6.8 | 4.2 |
| 🇨🇴 Colombia | 33.8 | 10.5 | 8.9 | 13.7 | 0.1 |
| 🇰🇲 Comoros | 26.8 | 0.1 | 14.3 | 3.0 | 1.2 |
| 🇨🇬 Congo | 23.2 | 6.8 | 24.5 | 1.9 | 8.1 |
| 🇨🇷 Costa Rica | 34.3 | 12.7 | 18.0 | 11.4 | 0.0 |
| 🇨🇮 Côte d’Ivoire | 2.9 | 1.0 | 23.2 | 1.4 | 6.5 |
| 🇭🇷 Croatia | 16.6 | 49.6 | 19.1 | 11.2 | 2.1 |
| 🇨🇺 Cuba | 37.7 | 21.6 | 6.1 | 7.4 | 4.9 |
| 🇨🇾 Cyprus | 28.4 | 36.8 | 25.5 | 5.9 | 4.6 |
| 🇨🇿 Czechia | 23.5 | 44.5 | 10.5 | 10.2 | 0.9 |
| 🇩🇰 Denmark | 24.6 | 13.5 | 26.5 | 24.3 | 1.3 |
| 🇩🇯 Djibouti | 3.6 | 0.1 | 3.5 | 6.2 | 5.4 |
| 🇩🇲 Dominica | 39.4 | 11.4 | 27.9 | 8.1 | 1.1 |
| 🇩🇴 Dominican Republic | 32.2 | 9.9 | 8.5 | 6.3 | 0.2 |
| 🇨🇩 DR Congo | 1.3 | 0.5 | 4.2 | 0.3 | 1.2 |
| 🇪🇨 Ecuador | 18.9 | 12.9 | 8.2 | 13.3 | 0.4 |
| 🇪🇬 Egypt | 14.3 | 0.0 | 27.1 | 7.4 | 1.5 |
| 🇸🇻 El Salvador | 25.9 | 4.7 | 6.5 | 8.2 | 0.0 |
| 🇪🇪 Estonia | 21.1 | 37.7 | 14.7 | 8.5 | 0.5 |
| 🇸🇿 Eswatini | 7.3 | 2.0 | 4.3 | 16.1 | 2.0 |
| 🇪🇹 Ethiopia | 0.6 | 0.0 | 0.5 | 3.8 | 3.5 |
| 🇫🇯 Fiji | 28.8 | 3.7 | 26.5 | 3.1 | 5.3 |
| 🇫🇮 Finland | 21.1 | 30.8 | 33.5 | 18.4 | 1.1 |
| 🇫🇷 France | 23.0 | 31.0 | 33.2 | 20.8 | 3.5 |
| 🇵🇫 French Polynesia | 48.8 | 14.3 | 47.3 | 21.4 | 3.7 |
| 🇬🇦 Gabon | 39.7 | 8.3 | 28.7 | 4.7 | 14.3 |
| 🇬🇲 Gambia | 10.6 | 0.3 | 25.2 | 3.4 | 1.1 |
| 🇬🇪 Georgia | 18.2 | 9.3 | 10.0 | 5.8 | 1.8 |
| 🇩🇪 Germany | 18.3 | 44.0 | 12.6 | 14.6 | 1.8 |
| 🇬🇭 Ghana | 11.6 | 1.2 | 24.9 | 1.6 | 4.2 |
| 🇬🇷 Greece | 25.6 | 25.0 | 21.7 | 14.5 | 9.4 |
| 🇬🇩 Grenada | 37.4 | 14.6 | 33.8 | 4.1 | 1.4 |
| 🇬🇹 Guatemala | 28.7 | 3.6 | 3.0 | 11.7 | 0.3 |
| 🇬🇳 Guinea | 2.7 | 0.2 | 9.7 | 8.2 | 2.8 |
| 🇬🇼 Guinea-Bissau | 3.1 | 7.2 | 1.2 | 3.7 | 1.3 |
| 🇬🇾 Guyana | 41.4 | 5.0 | 25.0 | 4.2 | 1.2 |
| 🇭🇹 Haiti | 10.9 | 4.0 | 5.0 | 4.2 | 0.9 |
| 🇭🇳 Honduras | 21.6 | 5.0 | 2.6 | 6.0 | 0.1 |
| 🇭🇰 Hong Kong | 55.5 | 55.2 | 65.8 | 22.5 | 3.0 |
| 🇭🇺 Hungary | 29.8 | 48.3 | 6.4 | 4.6 | 0.3 |
| 🇮🇸 Iceland | 30.0 | 21.8 | 90.6 | 14.0 | 24.4 |
| 🇮🇳 India | 2.6 | 0.2 | 8.0 | 1.1 | 0.6 |
| 🇮🇩 Indonesia | 13.7 | 0.9 | 44.4 | 2.8 | 0.5 |
| 🇮🇷 Iran | 26.0 | 0.0 | 12.6 | 7.6 | 4.5 |
| 🇮🇶 Iraq | 5.4 | 0.0 | 3.6 | 3.1 | 1.7 |
| 🇮🇪 Ireland | 24.7 | 31.1 | 22.6 | 19.8 | 3.6 |
| 🇮🇱 Israel | 68.9 | 1.6 | 24.7 | 27.2 | 1.7 |
| 🇮🇹 Italy | 19.6 | 32.9 | 29.2 | 15.9 | 1.8 |
| 🇯🇲 Jamaica | 53.9 | 3.1 | 25.2 | 3.8 | 0.7 |
| 🇯🇵 Japan | 22.3 | 21.3 | 46.2 | 9.6 | 0.3 |
| 🇯🇴 Jordan | 26.1 | 0.0 | 5.1 | 6.8 | 4.8 |
| 🇰🇿 Kazakhstan | 21.2 | 8.2 | 2.8 | 26.6 | 15.9 |
| 🇰🇪 Kenya | 1.3 | 0.4 | 2.9 | 4.5 | 4.5 |
| 🇰🇮 Kiribati | 26.6 | 10.3 | 73.2 | 1.9 | 0.3 |
| 🇰🇼 Kuwait | 46.6 | 0.0 | 14.0 | 9.4 | 16.7 |
| 🇰🇬 Kyrgyzstan | 5.2 | 2.1 | 1.1 | 14.9 | 10.0 |
| 🇱🇦 Laos | 6.6 | 13.5 | 24.1 | 8.4 | 0.5 |
| 🇱🇻 Latvia | 26.2 | 38.4 | 25.0 | 5.3 | 0.8 |
| 🇱🇧 Lebanon | 18.6 | 0.6 | 8.7 | 9.2 | 1.1 |
| 🇱🇸 Lesotho | 2.1 | 3.8 | 3.0 | 2.0 | 3.9 |
| 🇱🇷 Liberia | 11.3 | 5.3 | 4.3 | 0.4 | 2.1 |
| 🇱🇾 Libya | 32.8 | 0.0 | 14.3 | 2.9 | 6.5 |
| 🇱🇹 Lithuania | 33.3 | 50.7 | 33.1 | 5.9 | 1.1 |
| 🇱🇺 Luxembourg | 18.1 | 33.1 | 31.7 | 25.7 | 2.0 |
| 🇲🇴 Macao | 45.6 | 46.9 | 73.2 | 9.4 | 1.8 |
| 🇲🇬 Madagascar | 3.1 | 1.0 | 4.0 | 1.3 | 0.5 |
| 🇲🇼 Malawi | 5.7 | 11.8 | 10.1 | 2.9 | 3.1 |
| 🇲🇾 Malaysia | 50.2 | 7.4 | 54.7 | 6.0 | 1.0 |
| 🇲🇻 Maldives | 11.0 | 0.4 | 83.1 | 5.9 | 0.8 |
| 🇲🇱 Mali | 2.4 | 0.1 | 8.5 | 3.6 | 2.6 |
| 🇲🇹 Malta | 25.2 | 25.8 | 22.8 | 26.4 | 1.8 |
| 🇲🇷 Mauritania | 6.3 | 0.0 | 8.4 | 6.4 | 18.4 |
| 🇲🇺 Mauritius | 38.7 | 3.2 | 24.0 | 4.5 | 4.2 |
| 🇲🇽 Mexico | 35.9 | 19.1 | 13.6 | 14.6 | 1.5 |
| 🇫🇲 Micronesia | 38.2 | 16.2 | 47.4 | 4.9 | 0.2 |
| 🇲🇩 Moldova | 17.2 | 19.2 | 11.7 | 1.9 | 0.3 |
| 🇲🇳 Mongolia | 3.0 | 0.6 | 0.6 | 26.6 | 81.4 |
| 🇲🇪 Montenegro | 17.1 | 43.2 | 15.6 | 15.0 | 2.1 |
| 🇲🇦 Morocco | 24.0 | 0.0 | 18.4 | 7.7 | 6.9 |
| 🇲🇿 Mozambique | 3.8 | 3.1 | 13.4 | 0.6 | 0.1 |
| 🇲🇲 Myanmar | 29.9 | 20.1 | 45.0 | 9.3 | 1.7 |
| 🇳🇦 Namibia | 10.2 | 4.5 | 11.9 | 8.8 | 8.9 |
| 🇳🇷 Nauru | 51.0 | 28.2 | 51.0 | 19.1 | 6.9 |
| 🇳🇵 Nepal | 2.3 | 1.0 | 3.5 | 8.2 | 2.7 |
| 🇳🇱 Netherlands | 10.0 | 27.7 | 21.9 | 16.2 | 5.2 |
| 🇳🇨 New Caledonia | 40.9 | 17.4 | 23.4 | 17.7 | 2.3 |
| 🇳🇿 New Zealand | 26.0 | 25.2 | 26.4 | 18.6 | 15.3 |
| 🇳🇮 Nicaragua | 21.8 | 5.3 | 6.6 | 2.2 | 0.4 |
| 🇳🇪 Niger | 1.0 | 0.1 | 1.8 | 2.8 | 4.4 |
| 🇳🇬 Nigeria | 1.2 | 1.5 | 6.7 | 1.6 | 2.8 |
| 🇰🇵 North Korea | 1.8 | 4.3 | 11.0 | 0.8 | 6.7 |
| 🇲🇰 North Macedonia | 20.0 | 12.6 | 6.2 | 6.8 | 0.9 |
| 🇳🇴 Norway | 20.0 | 23.7 | 50.2 | 17.8 | 5.8 |
| 🇴🇲 Oman | 19.7 | 0.4 | 26.1 | 9.0 | 14.3 |
| 🇵🇰 Pakistan | 6.2 | 0.0 | 1.6 | 9.8 | 2.6 |
| 🇵🇦 Panama | 55.4 | 15.9 | 13.7 | 14.5 | 1.0 |
| 🇵🇬 Papua New Guinea | 3.9 | 9.9 | 14.6 | 0.8 | 47.8 |
| 🇵🇾 Paraguay | 9.6 | 8.8 | 4.0 | 21.9 | 0.6 |
| 🇵🇪 Peru | 42.7 | 4.5 | 27.1 | 4.2 | 1.9 |
| 🇵🇭 Philippines | 15.9 | 14.5 | 29.1 | 3.1 | 0.3 |
| 🇵🇱 Poland | 32.9 | 55.0 | 12.5 | 1.5 | 0.1 |
| 🇵🇹 Portugal | 30.6 | 38.1 | 60.0 | 18.8 | 2.8 |
| 🇶🇦 Qatar | 54.3 | 1.2 | 21.1 | 8.4 | 12.1 |
| 🇷🇴 Romania | 23.9 | 34.5 | 8.3 | 5.2 | 2.7 |
| 🇷🇺 Russia | 30.8 | 28.2 | 21.7 | 12.9 | 5.1 |
| 🇷🇼 Rwanda | 1.5 | 1.0 | 4.6 | 2.7 | 3.2 |
| 🇰🇳 Saint Kitts & Nevis | 48.7 | 15.5 | 38.8 | 2.9 | 2.5 |
| 🇱🇨 Saint Lucia | 57.6 | 14.9 | 33.6 | 3.8 | 2.0 |
| 🇻🇨 Saint Vincent & the Grenadines | 74.7 | 11.3 | 19.4 | 7.8 | 0.7 |
| 🇼🇸 Samoa | 65.7 | 12.3 | 47.6 | 6.9 | 3.5 |
| 🇸🇹 Sao Tome & Principe | 17.1 | 4.7 | 27.7 | 1.7 | 0.1 |
| 🇸🇦 Saudi Arabia | 43.0 | 0.0 | 11.7 | 4.4 | 7.7 |
| 🇸🇳 Senegal | 7.4 | 1.2 | 11.9 | 5.0 | 3.7 |
| 🇷🇸 Serbia | 14.1 | 37.3 | 6.7 | 6.1 | 4.1 |
| 🇸🇨 Seychelles | 36.9 | 13.7 | 56.8 | 9.2 | 2.7 |
| 🇸🇱 Sierra Leone | 5.4 | 1.0 | 25.5 | 1.3 | 1.9 |
| 🇸🇰 Slovakia | 16.9 | 38.8 | 10.2 | 5.8 | 0.9 |
| 🇸🇮 Slovenia | 30.4 | 25.8 | 13.2 | 15.3 | 1.1 |
| 🇸🇧 Solomon Islands | 6.1 | 4.4 | 28.1 | 1.8 | 0.1 |
| 🇿🇦 South Africa | 34.9 | 4.2 | 6.5 | 17.2 | 3.5 |
| 🇰🇷 South Korea | 22.8 | 38.4 | 55.3 | 16.9 | 0.5 |
| 🇸🇸 South Sudan | 4.3 | 0.0 | 2.9 | 12.4 | 4.3 |
| 🇪🇸 Spain | 33.6 | 52.6 | 40.8 | 12.3 | 3.4 |
| 🇱🇰 Sri Lanka | 10.4 | 0.1 | 29.0 | 1.2 | 0.1 |
| 🇸🇩 Sudan | 1.9 | 0.0 | 1.1 | 8.0 | 10.5 |
| 🇸🇷 Suriname | 49.6 | 8.0 | 16.5 | 4.4 | 0.3 |
| 🇸🇪 Sweden | 15.4 | 28.6 | 32.2 | 22.5 | 1.5 |
| 🇨🇭 Switzerland | 16.9 | 27.8 | 16.0 | 19.1 | 2.4 |
| 🇸🇾 Syria | 6.4 | 0.0 | 2.2 | 2.2 | 7.3 |
| 🇹🇼 Taiwan | 41.6 | 38.4 | 29.8 | 6.1 | 0.9 |
| 🇹🇯 Tajikistan | 3.5 | 0.1 | 0.7 | 25.8 | 7.8 |
| 🇹🇿 Tanzania | 1.5 | 0.3 | 6.4 | 7.8 | 1.6 |
| 🇹🇭 Thailand | 11.4 | 13.1 | 29.2 | 1.2 | 0.0 |
| 🇹🇱 Timor-Leste | 9.4 | 11.5 | 6.4 | 1.6 | 0.4 |
| 🇹🇬 Togo | 7.2 | 2.3 | 11.7 | 0.8 | 2.2 |
| 🇹🇹 Trinidad & Tobago | 63.1 | 5.6 | 23.6 | 5.7 | 1.5 |
| 🇹🇳 Tunisia | 17.9 | 0.0 | 14.1 | 3.7 | 5.8 |
| 🇹🇷 Türkiye | 20.0 | 0.0 | 5.5 | 16.0 | 1.3 |
| 🇹🇲 Turkmenistan | 6.1 | 0.1 | 2.8 | 22.5 | 20.8 |
| 🇺🇸 U.S. | 58.7 | 30.6 | 22.8 | 37.9 | 1.4 |
| 🇦🇪 UAE | 31.1 | 0.0 | 25.4 | 6.7 | 10.4 |
| 🇺🇬 Uganda | 1.5 | 2.9 | 14.3 | 3.6 | 1.0 |
| 🇬🇧 UK | 32.7 | 24.0 | 17.9 | 17.4 | 5.0 |
| 🇺🇦 Ukraine | 24.9 | 16.7 | 13.8 | 7.2 | 0.7 |
| 🇺🇾 Uruguay | 21.0 | 14.1 | 9.1 | 19.4 | 3.5 |
| 🇺🇿 Uzbekistan | 3.1 | 0.2 | 4.0 | 31.6 | 6.1 |
| 🇻🇺 Vanuatu | 14.6 | 12.4 | 29.0 | 7.2 | 0.3 |
| 🇻🇪 Venezuela | 16.1 | 4.4 | 10.2 | 12.0 | 0.3 |
| 🇻🇳 Vietnam | 15.8 | 38.2 | 39.6 | 6.1 | 0.5 |
| 🇾🇪 Yemen | 11.2 | 0.0 | 3.0 | 3.0 | 4.5 |
| 🇿🇲 Zambia | 2.6 | 1.5 | 13.1 | 9.3 | 2.7 |
| 🇿🇼 Zimbabwe | 4.6 | 0.7 | 3.0 | 42.3 | 4.3 |
The world’s largest consumers of meat per capita? Hong Kong, Iceland, and Macao have the highest total meat consumption, all above 170 kg (370 lbs) per capita.
We take a brief look through the biggest consumers of each type of meat below.
Who Eats the Most Poultry?
While the U.S. and China eat the most chicken by absolute numbers, the countries rank 7th and 112th respectively when it comes to poultry consumption on a per capita basis.
Several island nations—St. Vincent and the Grenadines, Trinidad & Tobago, Samoa—along with Israel eat more than 60 kilograms of poultry meat (about 15 large birds) per person on an annual basis.
Regionally, poultry consumption can be seen spanning almost all of the Americas, as well as in the UK and former British colonies Australia and South Africa, and in the Middle East.
Who Eats the Most Pork?
Despite eating more seafood and poultry, Hong Kong leads the world in pork consumption per capita annually at 55 kg (121 lbs). This is almost equivalent to the average amount of retail pork harvested from a single 250 lb pig.
Poland and Spain—who are also top pork producers—rank close behind Hong Kong with similar pork consumption numbers. Indeed, we can see pork as the most consumed meat in many European countries with local histories of pork foods, as well as in a few countries in Africa including Burkina Faso and one Southeast Asian country, Timor-Leste.
Who Eats the Most Fish and Seafood?
In the middle of the North Atlantic ocean, Iceland eats the most fish and seafood in the world, at a staggering 90 kg (nearly 200 lbs), per person per year. That also gives Iceland the crown for the highest per-capita consumption of any single type of meat.
Behind Iceland are other island and high coastline nations, including the Maldives, Hong Kong, Macao, and Portugal. Regionally we can see the importance of seafood reflected in East and South Asia, the Atlantic coastline of Africa, and the Nordic countries in Europe.
Who Eats the Most Beef?
Argentina’s 46-million-strong population eats nearly 47 kg (103 lbs) of bovine meat per person per year, the most by any country in the UN’s database.
The South American country has a rich culinary history with beef, as cattle brought by Spanish settlers flourished on the grassy plains of the region. Such is cattle’s importance on the continent that the gaucho—a horseman engaged in cattle work—is a folk symbol in Argentina, Uruguay and parts of Brazil (which ranks 5th in beef consumption).
The map of beef consumption highlights Central Asian countries including Uzbekistan and Eastern African countries including Ethiopia.
Who Eats the Most Mutton & Other Meat?
The people of Mongolia are unrivaled in their consumption of mutton and goat meat, devouring an impressive 66 kilograms (145 pounds) per capita annually. This voracious appetite for meat is deeply rooted in their heritage as a nation of skilled shepherds.
Papua New Guinea, meanwhile, tops the “other meat” consumption rankings. The country is the largest producer of game meat in the world, due to its mostly rural and indigenous population relying on hunting. One 2023 study found that a sample of villages in the country primarily hunted wild deer and boar for meat, although marsupials like bandicoots, tree-kangaroos, and cuscus were occasionally hunted and consumed as well.
Mongolia also ranks highly in consumption of other meat per capita, likely due to their traditional consumption of horse meat. The country produced just over 100,000 tons of horse meat in 2020, one-sixth of the country’s total meat production that year.
Mapping Meat Consumption By Country, Without Seafood
What happens to each country’s meat consumption habits if we remove fish and seafood from the dataset? The map, and the rankings change quite a bit.
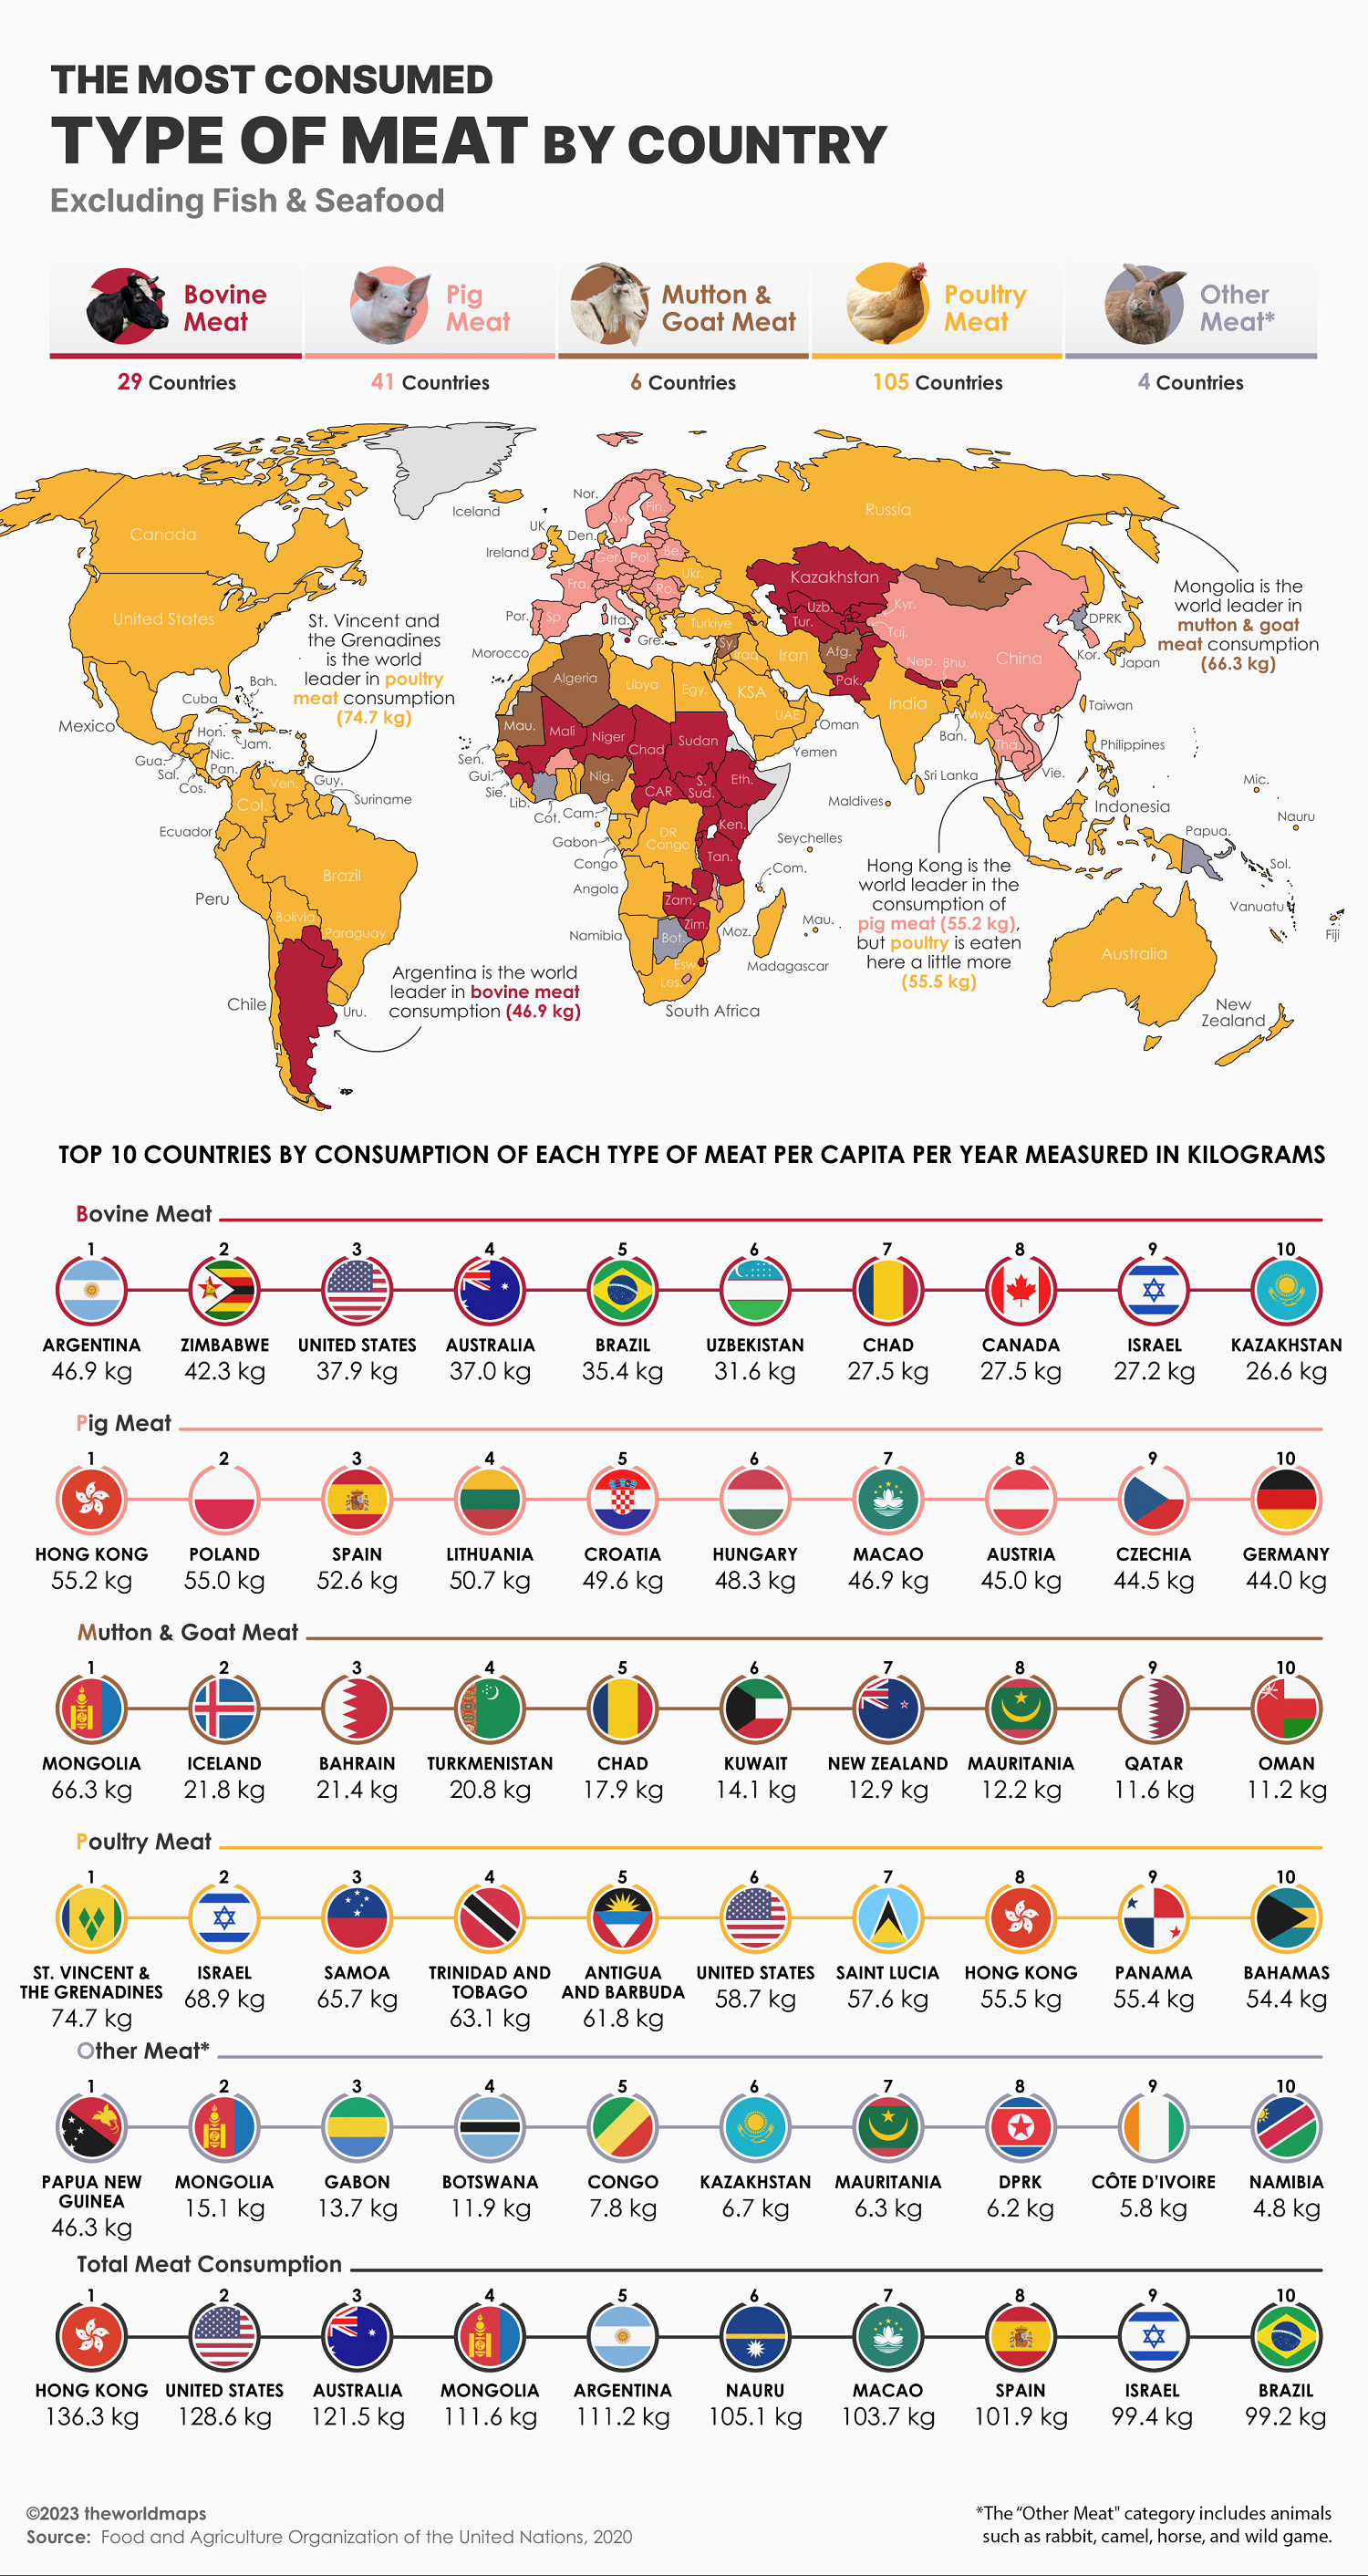
Most of the blue on the map is replaced with a wash of yellow, indicating the global popularity of poultry meat as a cheap and efficient source of protein. However, much of East Asia including China and European countries like France and Sweden consume more pork.
The rankings for total meat consumption also shuffle.
| Country | Total (With Seafood) | Total (Without Seafood) |
|---|---|---|
| 🇦🇫 Afghanistan | 9.6 | 9.3 |
| 🇦🇱 Albania | 47.8 | 39.1 |
| 🇩🇿 Algeria | 22.4 | 18.6 |
| 🇦🇴 Angola | 34.1 | 19.9 |
| 🇦🇬 Antigua & Barbuda | 136.2 | 82.1 |
| 🇦🇷 Argentina | 116.9 | 110.2 |
| 🇦🇲 Armenia | 56.4 | 50.9 |
| 🇦🇺 Australia | 145.6 | 121.5 |
| 🇦🇹 Austria | 91.2 | 76.9 |
| 🇦🇿 Azerbaijan | 38.9 | 36.9 |
| 🇧🇸 Bahamas | 109.3 | 85.1 |
| 🇧🇭 Bahrain | 96.9 | 80.6 |
| 🇧🇩 Bangladesh | 31.1 | 4.3 |
| 🇧🇧 Barbados | 115.8 | 73.0 |
| 🇧🇾 Belarus | 102.2 | 90.4 |
| 🇧🇪 Belgium | 84.5 | 61.9 |
| 🇧🇿 Belize | 61.8 | 48.5 |
| 🇧🇯 Benin | 30.8 | 14.6 |
| 🇧🇹 Bhutan | 23.4 | 16.1 |
| 🇧🇴 Bolivia | 79.9 | 77.1 |
| 🇧🇦 Bosnia & Herzegovina | 50.1 | 42.8 |
| 🇧🇼 Botswana | 31.1 | 28.6 |
| 🇧🇷 Brazil | 107.2 | 99.2 |
| 🇧🇬 Bulgaria | 64.3 | 56.9 |
| 🇧🇫 Burkina Faso | 43.2 | 34.3 |
| 🇧🇮 Burundi | 5.7 | 3.1 |
| 🇨🇻 Cabo Verde | 41.2 | 30.4 |
| 🇰🇭 Cambodia | 58.6 | 12.9 |
| 🇨🇲 Cameroon | 30.8 | 11.6 |
| 🇨🇦 Canada | 111.3 | 90.6 |
| 🇨🇫 Central African Republic | 45.1 | 37.8 |
| 🇹🇩 Chad | 53.5 | 46.9 |
| 🇨🇱 Chile | 97.8 | 83.0 |
| 🇨🇳 China | 102.0 | 62.1 |
| 🇨🇴 Colombia | 67.0 | 58.1 |
| 🇰🇲 Comoros | 45.5 | 31.2 |
| 🇨🇬 Congo | 64.5 | 40.0 |
| 🇨🇷 Costa Rica | 76.4 | 58.5 |
| 🇨🇮 Côte d’Ivoire | 35.0 | 11.8 |
| 🇭🇷 Croatia | 98.6 | 79.5 |
| 🇨🇺 Cuba | 77.6 | 71.6 |
| 🇨🇾 Cyprus | 101.1 | 75.6 |
| 🇨🇿 Czechia | 89.6 | 79.2 |
| 🇩🇰 Denmark | 90.1 | 63.7 |
| 🇩🇯 Djibouti | 18.9 | 15.4 |
| 🇩🇲 Dominica | 87.9 | 60.1 |
| 🇩🇴 Dominican Republic | 57.1 | 48.6 |
| 🇨🇩 DR Congo | 7.4 | 3.3 |
| 🇪🇨 Ecuador | 53.6 | 45.4 |
| 🇪🇬 Egypt | 50.3 | 23.3 |
| 🇸🇻 El Salvador | 45.4 | 38.8 |
| 🇪🇪 Estonia | 82.4 | 67.8 |
| 🇸🇿 Eswatini | 31.7 | 27.4 |
| 🇪🇹 Ethiopia | 8.4 | 7.9 |
| 🇫🇯 Fiji | 67.4 | 40.9 |
| 🇫🇮 Finland | 104.8 | 71.4 |
| 🇫🇷 France | 111.5 | 78.2 |
| 🇵🇫 French Polynesia | 135.4 | 88.2 |
| 🇬🇦 Gabon | 95.7 | 67.0 |
| 🇬🇲 Gambia | 40.6 | 15.5 |
| 🇬🇪 Georgia | 45.1 | 35.1 |
| 🇩🇪 Germany | 91.4 | 78.8 |
| 🇬🇭 Ghana | 43.5 | 18.5 |
| 🇬🇷 Greece | 96.2 | 74.5 |
| 🇬🇩 Grenada | 91.3 | 57.5 |
| 🇬🇹 Guatemala | 47.2 | 44.2 |
| 🇬🇳 Guinea | 23.6 | 13.9 |
| 🇬🇼 Guinea-Bissau | 16.5 | 15.3 |
| 🇬🇾 Guyana | 76.8 | 51.8 |
| 🇭🇹 Haiti | 25.0 | 20.0 |
| 🇭🇳 Honduras | 35.4 | 32.8 |
| 🇭🇰 Hong Kong | 202.1 | 136.3 |
| 🇭🇺 Hungary | 89.3 | 82.9 |
| 🇮🇸 Iceland | 180.9 | 90.2 |
| 🇮🇳 India | 12.6 | 4.6 |
| 🇮🇩 Indonesia | 62.3 | 17.9 |
| 🇮🇷 Iran | 50.6 | 38.0 |
| 🇮🇶 Iraq | 13.8 | 10.2 |
| 🇮🇪 Ireland | 101.8 | 79.2 |
| 🇮🇱 Israel | 124.1 | 99.4 |
| 🇮🇹 Italy | 99.4 | 70.2 |
| 🇯🇲 Jamaica | 86.7 | 61.5 |
| 🇯🇵 Japan | 99.6 | 53.4 |
| 🇯🇴 Jordan | 42.8 | 37.7 |
| 🇰🇿 Kazakhstan | 74.7 | 71.9 |
| 🇰🇪 Kenya | 13.6 | 10.7 |
| 🇰🇮 Kiribati | 112.4 | 39.2 |
| 🇰🇼 Kuwait | 86.6 | 72.7 |
| 🇰🇬 Kyrgyzstan | 33.2 | 32.1 |
| 🇱🇦 Laos | 53.1 | 29.0 |
| 🇱🇻 Latvia | 95.8 | 70.8 |
| 🇱🇧 Lebanon | 38.2 | 29.5 |
| 🇱🇸 Lesotho | 14.7 | 11.7 |
| 🇱🇷 Liberia | 23.4 | 19.1 |
| 🇱🇾 Libya | 56.5 | 42.2 |
| 🇱🇹 Lithuania | 123.9 | 90.9 |
| 🇱🇺 Luxembourg | 110.6 | 78.9 |
| 🇲🇴 Macao | 176.9 | 103.7 |
| 🇲🇬 Madagascar | 9.8 | 5.8 |
| 🇲🇼 Malawi | 33.7 | 23.6 |
| 🇲🇾 Malaysia | 119.4 | 64.7 |
| 🇲🇻 Maldives | 101.2 | 18.1 |
| 🇲🇱 Mali | 17.1 | 8.6 |
| 🇲🇹 Malta | 102.0 | 79.1 |
| 🇲🇷 Mauritania | 39.5 | 31.1 |
| 🇲🇺 Mauritius | 74.5 | 50.5 |
| 🇲🇽 Mexico | 84.7 | 71.1 |
| 🇫🇲 Micronesia | 106.7 | 59.4 |
| 🇲🇩 Moldova | 50.3 | 38.6 |
| 🇲🇳 Mongolia | 112.1 | 111.6 |
| 🇲🇪 Montenegro | 93.0 | 77.4 |
| 🇲🇦 Morocco | 57.0 | 38.6 |
| 🇲🇿 Mozambique | 21.0 | 7.6 |
| 🇲🇲 Myanmar | 106.0 | 61.0 |
| 🇳🇦 Namibia | 44.3 | 32.4 |
| 🇳🇷 Nauru | 156.2 | 105.1 |
| 🇳🇵 Nepal | 17.7 | 14.2 |
| 🇳🇱 Netherlands | 81.0 | 59.1 |
| 🇳🇨 New Caledonia | 101.7 | 78.3 |
| 🇳🇿 New Zealand | 111.4 | 85.0 |
| 🇳🇮 Nicaragua | 36.3 | 29.6 |
| 🇳🇪 Niger | 10.1 | 8.3 |
| 🇳🇬 Nigeria | 13.8 | 7.0 |
| 🇰🇵 North Korea | 24.6 | 13.6 |
| 🇲🇰 North Macedonia | 46.6 | 40.3 |
| 🇳🇴 Norway | 117.4 | 67.2 |
| 🇴🇲 Oman | 69.5 | 43.4 |
| 🇵🇰 Pakistan | 20.2 | 18.6 |
| 🇵🇦 Panama | 100.5 | 86.8 |
| 🇵🇬 Papua New Guinea | 77.0 | 62.4 |
| 🇵🇾 Paraguay | 44.9 | 40.9 |
| 🇵🇪 Peru | 80.5 | 53.4 |
| 🇵🇭 Philippines | 62.8 | 33.7 |
| 🇵🇱 Poland | 102.0 | 89.5 |
| 🇵🇹 Portugal | 150.2 | 90.2 |
| 🇶🇦 Qatar | 96.9 | 75.9 |
| 🇷🇴 Romania | 74.7 | 66.4 |
| 🇷🇺 Russia | 98.6 | 76.9 |
| 🇷🇼 Rwanda | 12.9 | 8.4 |
| 🇰🇳 Saint Kitts & Nevis | 108.5 | 69.7 |
| 🇱🇨 Saint Lucia | 111.9 | 78.3 |
| 🇻🇨 Saint Vincent & the Grenadines | 113.8 | 94.4 |
| 🇼🇸 Samoa | 135.9 | 88.3 |
| 🇸🇹 Sao Tome & Principe | 51.3 | 23.6 |
| 🇸🇦 Saudi Arabia | 66.8 | 55.0 |
| 🇸🇳 Senegal | 29.1 | 17.2 |
| 🇷🇸 Serbia | 68.3 | 61.6 |
| 🇸🇨 Seychelles | 119.2 | 62.5 |
| 🇸🇱 Sierra Leone | 35.0 | 9.5 |
| 🇸🇰 Slovakia | 72.7 | 62.5 |
| 🇸🇮 Slovenia | 85.7 | 72.5 |
| 🇸🇧 Solomon Islands | 40.5 | 12.4 |
| 🇿🇦 South Africa | 66.2 | 59.8 |
| 🇰🇷 South Korea | 133.8 | 78.5 |
| 🇸🇸 South Sudan | 23.9 | 21.0 |
| 🇪🇸 Spain | 142.7 | 101.9 |
| 🇱🇰 Sri Lanka | 40.8 | 11.8 |
| 🇸🇩 Sudan | 21.5 | 20.3 |
| 🇸🇷 Suriname | 78.8 | 62.3 |
| 🇸🇪 Sweden | 100.2 | 68.0 |
| 🇨🇭 Switzerland | 82.2 | 66.2 |
| 🇸🇾 Syria | 18.0 | 15.8 |
| 🇹🇼 Taiwan | 116.7 | 87.0 |
| 🇹🇯 Tajikistan | 37.9 | 37.2 |
| 🇹🇿 Tanzania | 17.6 | 11.2 |
| 🇹🇭 Thailand | 54.9 | 25.8 |
| 🇹🇱 Timor-Leste | 29.3 | 22.9 |
| 🇹🇬 Togo | 24.2 | 12.5 |
| 🇹🇹 Trinidad & Tobago | 99.5 | 75.9 |
| 🇹🇳 Tunisia | 41.4 | 27.3 |
| 🇹🇷 Türkiye | 42.8 | 37.3 |
| 🇹🇲 Turkmenistan | 52.2 | 49.4 |
| 🇺🇸 U.S. | 151.4 | 128.6 |
| 🇦🇪 UAE | 73.6 | 48.2 |
| 🇺🇬 Uganda | 23.3 | 9.0 |
| 🇬🇧 UK | 97.0 | 79.1 |
| 🇺🇦 Ukraine | 63.3 | 49.5 |
| 🇺🇾 Uruguay | 67.3 | 58.1 |
| 🇺🇿 Uzbekistan | 45.0 | 41.0 |
| 🇻🇺 Vanuatu | 63.5 | 34.5 |
| 🇻🇪 Venezuela | 43.1 | 32.9 |
| 🇻🇳 Vietnam | 100.2 | 60.6 |
| 🇾🇪 Yemen | 21.7 | 18.7 |
| 🇿🇲 Zambia | 29.3 | 16.2 |
| 🇿🇼 Zimbabwe | 54.9 | 51.9 |
Hong Kong remains at the top, but the U.S. jumps up three spots to second place, with annual per capita meat consumption at 128 kg (282 lbs) when seafood isn’t included.
Iceland and Macao drop to the top 15, while Australia, Mongolia, and Argentina climb into the top five. Other countries that preferred seafood dropped a lot lower, such as Japan, which fell 40 spots in the total consumption rankings when fish was removed.

-

 Markets1 week ago
The 50 Best One-Year Returns on the S&P 500 (1980-2022)
-

 Stocks3 weeks ago
What are Top Investment Managers Holding in Their Portfolios?
-
 Maps1 week ago
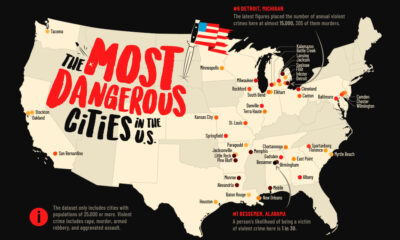
Mapped: The Most Dangerous Cities in the U.S.
-

 United States3 weeks ago
Chart: U.S. Home Price Growth Over 50 Years
-
 Maps7 days ago
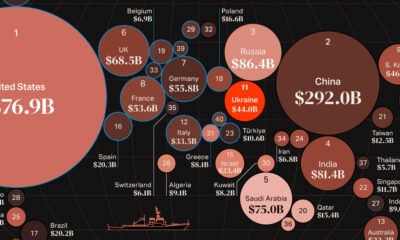
Mapped: World’s Top 40 Largest Military Budgets
-
 Energy3 weeks ago
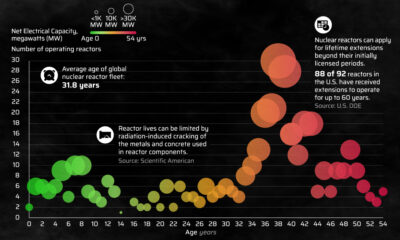
How Old Are the World’s Nuclear Reactors?
-
 Cities6 days ago
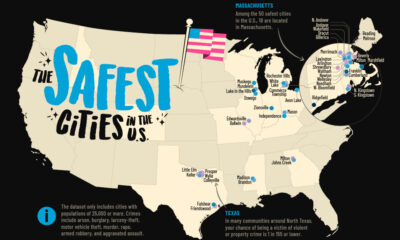
Mapped: The Safest Cities in the U.S.
-
 Energy3 weeks ago
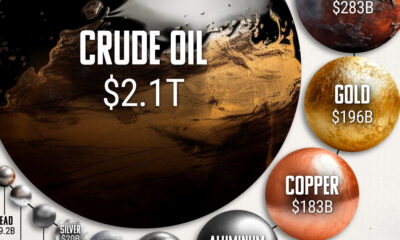
How Big is the Market for Crude Oil?