Healthcare
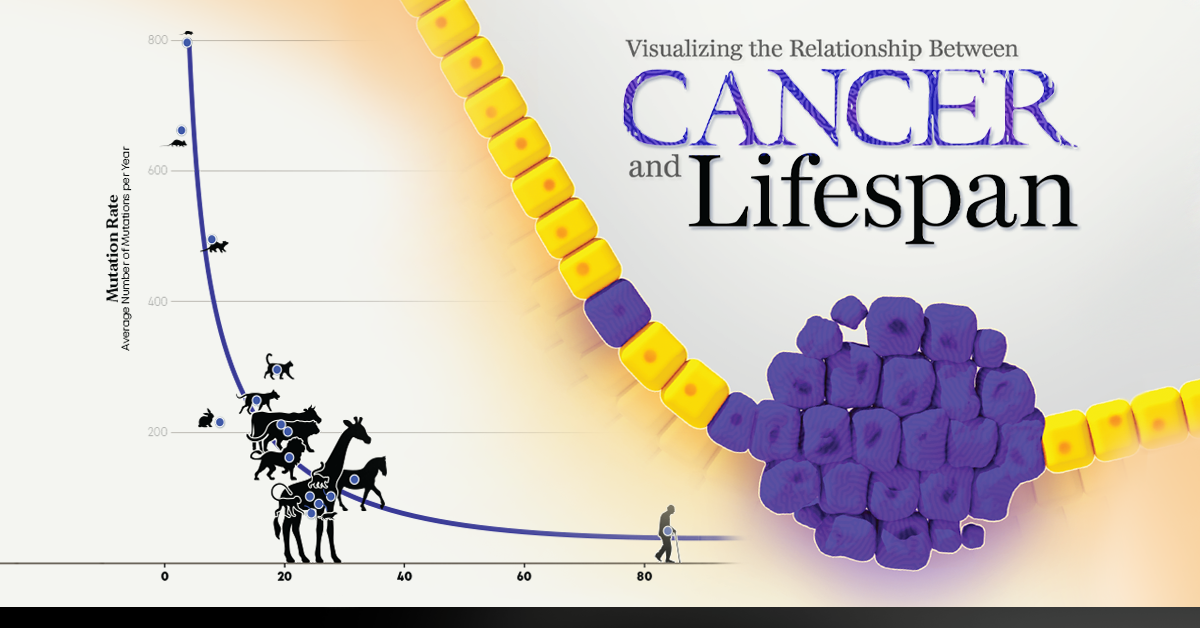
Visualizing the Relationship Between Cancer and Lifespan


A Newfound Link Between Cancer and Aging?
A new study in 2022 reveals a thought-provoking relationship between how long animals live and how quickly their genetic codes mutate.
Cancer is a product of time and mutations, and so researchers investigated its onset and impact within 16 unique mammals. A new perspective on DNA mutation broadens our understanding of aging and cancer development—and how we might be able to control it.
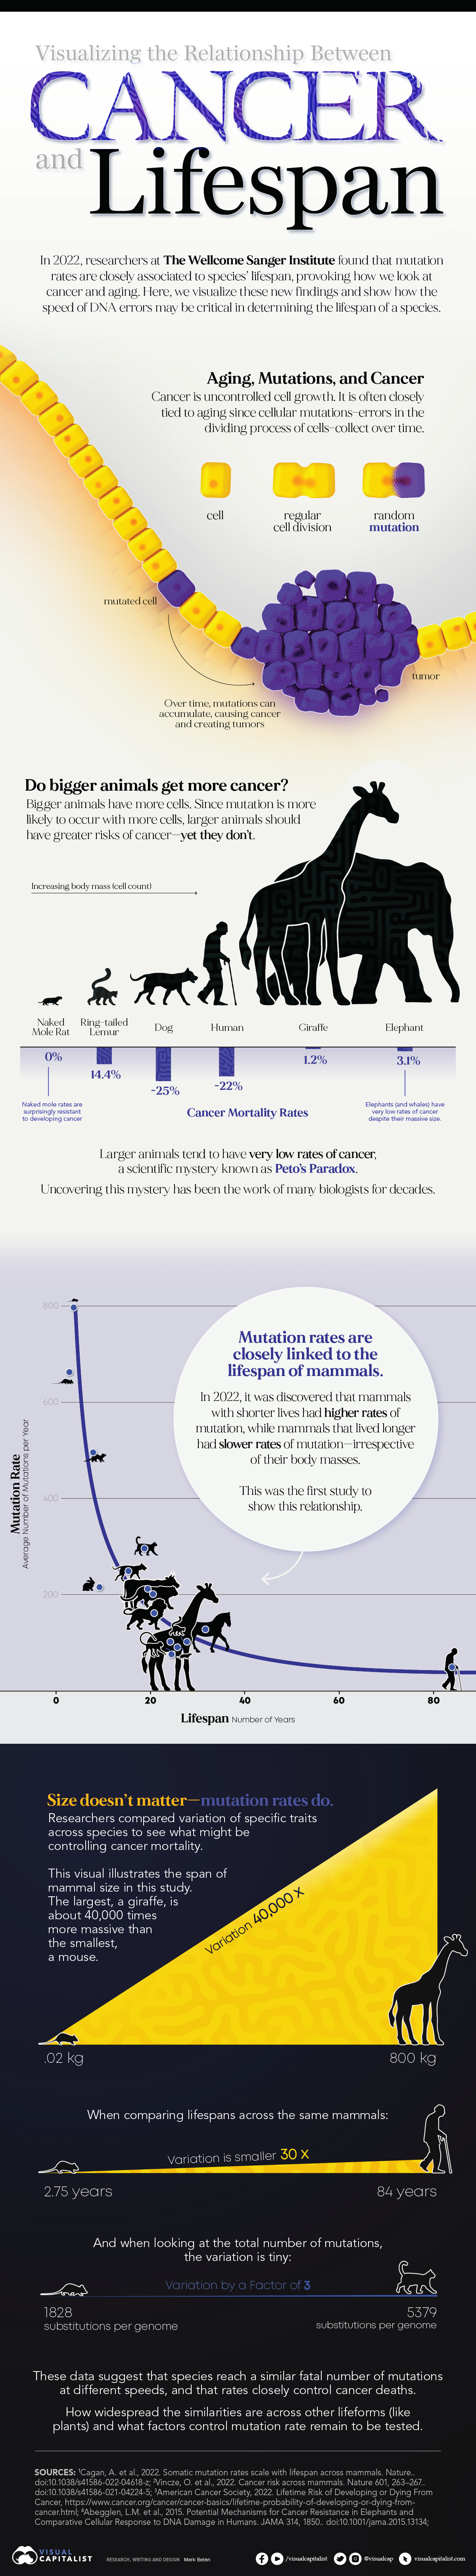
Mutations, Aging, and Cancer: A Primer
Cancer is the uncontrolled growth of cells. It is not a pathogen that infects the body, but a normal body process gone wrong.
Cells divide and multiply in our bodies all the time. Sometimes, during DNA replication, tiny mistakes (called mutations) appear randomly within the genetic code. Our bodies have mechanisms to correct these errors, and for much of our youth we remain strong and healthy as a result of these corrective measures.
However, these protections weaken as we age. Developing cancer becomes more likely as mutations slip past our defenses and continue to multiply. The longer we live, the more mutations we carry, and the likelihood of them manifesting into cancer increases.
A Biological Conundrum
Since mutations can occur randomly, biologists expect larger lifeforms (those with more cells) to have greater chances of developing cancer than smaller lifeforms.
Strangely, no association exists.
It is one of biology’s biggest mysteries as to why massive creatures like whales or elephants rarely seem to experience cancer. This is called Peto’s Paradox. Even stranger: some smaller creatures, like the naked mole rat, are completely resistant to cancer.
This phenomenon motivates researchers to look into the genetics of naked mole rats and whales. And while we’ve discovered that special genetic bonuses (like extra tumor-suppressing genes) benefit these creatures, a pattern for cancer rates across all other species is still poorly understood.
Cancer May Be Closely Associated with Lifespan
Researchers at the Wellcome Sanger Institute report the first study to look at how mutation rates compare with animal lifespans.
Mutation rates are simply the speed at which species beget mutations. Mammals with shorter lifespans have average mutation rates that are very fast. A mouse undergoes nearly 800 mutations in each of its four short years on Earth. Mammals with longer lifespans have average mutation rates that are much slower. In humans (average lifespan of roughly 84 years), it comes to fewer than 50 mutations per year.
The study also compares the number of mutations at time of death with other traits, like body mass and lifespan. For example, a giraffe has roughly 40,000 times more cells than a mouse. Or a human lives 90 times longer than a mouse. What surprised researchers was that the number of mutations at time of death differed only by a factor of three.
Such small differentiation suggests there may be a total number of mutations a species can collect before it dies. Since the mammals reached this number at different speeds, finding ways to control the rate of mutations may help stall cancer development, set back aging, and prolong life.
The Future of Cancer Research
The findings in this study ignite new questions for understanding cancer.
Confirming that mutation rate and lifespan are strongly correlated needs comparison to lifeforms beyond mammals, like fishes, birds, and even plants.
It will also be necessary to understand what factors control mutation rates. The answer to this likely lies within the complexities of DNA. Geneticists and oncologists are continuing to investigate genetic curiosities like tumor-suppressing genes and how they might impact mutation rates.
Aging is likely to be a confluence of many issues, like epigenetic changes or telomere shortening, but if mutations are involved then there may be hopes of slowing genetic damage—or even reversing it.
While just a first step, linking mutation rates to lifespan is a reframing of our understanding of cancer development, and it may open doors to new strategies and therapies for treating cancer or taming the number of health-related concerns that come with aging.


population
Charted: The Rapid Decline of Global Birth Rates
For the last 70 years, birth rates for the 49 most populous countries of the world have fallen sharply, heralding an uncertain future.
 Creator Program
Charted: The Rapid Decline in Global Birth Rates
In 1798, British economist Thomas Malthus proposed a groundbreaking theory now known as the “Malthusian Trap”—suggesting that human population growth is exponential and thus would outpace the linear growth of resources such as food supply.
He worried that this runaway population growth would become unsustainable, eventually relying on sudden shock events—wars, disasters, famines—to reset the population to more sustainable levels. And over the next 200 years, the world population skyrocketed from 1 billion to 8 billion people on the planet.
However, as it turns out, no such shock events were required to turn the tide of population growth. Instead, it’s been rapidly declining birth rates across the world that seem to be leading to an unthinkable outcome for Malthus: a gradually plateauing or even shrinking global population.
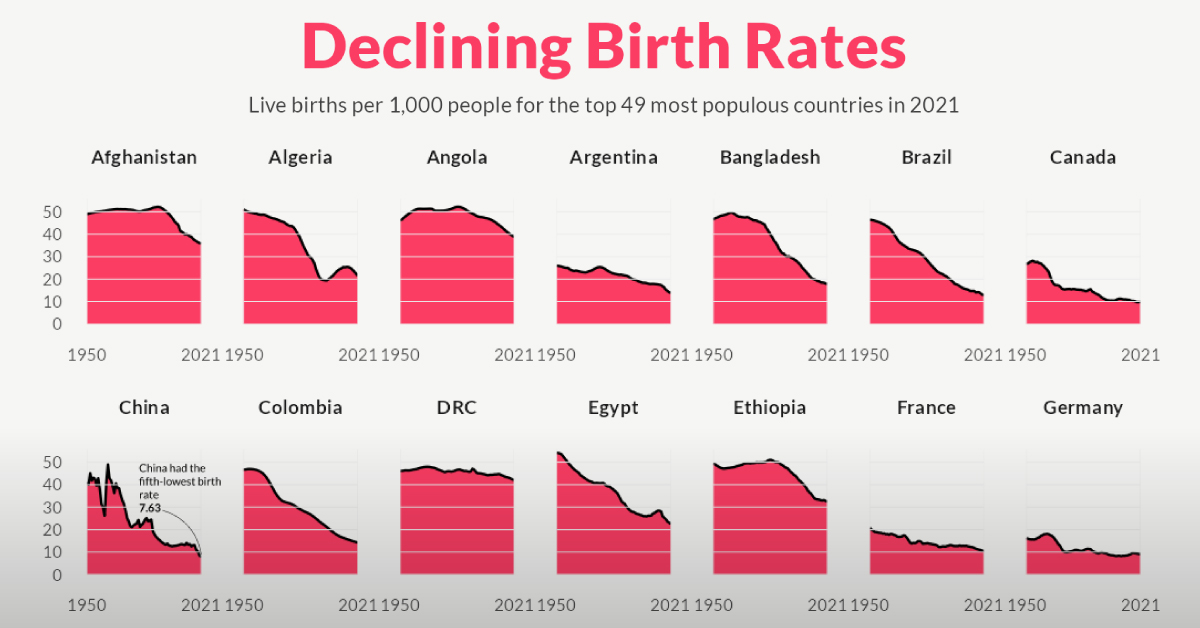
In the visualization above, Pablo Alvarez has visualized the crude birth rate for the 49 most populous countries of the world in 2021, using data from the UN’s World Population Prospects 2022 to examine changes since 1950.
Understanding Birth Rates vs Fertility Rates
Birth rates are commonly measured using a metric called the “crude birth rate” (CBR), which represents the number of live births per 1,000 individuals in a given population during a specific period—usually one year.
The measured decline in CBR is also a result of plummeting fertility rates across the globe. Not to be confused with birth rates, fertility rates measure how many children a woman will have over the course of her lifetime.
While a country’s birth rate is directly impacted by the fertility rate, it also takes into account other factors: population size, age structure of the population, access to contraception, cultural norms, government policies, and socioeconomic conditions.
Birth Rates of the Most Populated Countries
Here’s a snapshot of the CBR for the 49 most populous countries of the world at different years from 1950 to 2021.
| Country | 1950 | 1990 | 2021 | % Change (1950-2021) |
|---|---|---|---|---|
| 🇦🇫 Afghanistan | 48.87 | 51.42 | 35.84 | -27% |
| 🇩🇿 Algeria | 51.05 | 30.76 | 21.52 | -58% |
| 🇦🇴 Angola | 46.15 | 51.34 | 38.81 | -16% |
| 🇦🇷 Argentina | 26.00 | 21.99 | 13.90 | -47% |
| 🇧🇩 Bangladesh | 46.52 | 34.97 | 17.82 | -62% |
| 🇧🇷 Brazil | 46.43 | 24.84 | 12.88 | -72% |
| 🇨🇦 Canada | 26.80 | 15.46 | 9.82 | -63% |
| 🇨🇳 China | 41.05 | 24.44 | 7.63 | -81% |
| 🇨🇴 Colombia | 46.74 | 27.37 | 14.20 | -70% |
| 🇨🇩 DRC | 46.02 | 46.01 | 42.05 | -9% |
| 🇪🇬 Egypt | 54.20 | 33.21 | 22.56 | -58% |
| 🇪🇹 Ethiopia | 49.40 | 50.05 | 32.38 | -34% |
| 🇫🇷 France | 20.77 | 13.34 | 10.50 | -49% |
| 🇩🇪 Germany | 16.22 | 11.30 | 9.17 | -43% |
| 🇬🇭 Ghana | 46.76 | 40.37 | 27.55 | -41% |
| 🇮🇳 India | 43.84 | 31.82 | 16.42 | -63% |
| 🇮🇩 Indonesia | 40.64 | 25.52 | 16.42 | -60% |
| 🇮🇷 Iran | 50.14 | 32.46 | 13.70 | -73% |
| 🇮🇶 Iraq | 45.73 | 39.41 | 27.37 | -40% |
| 🇮🇹 Italy | 19.70 | 10.01 | 6.93 | -65% |
| 🇯🇵 Japan | 28.34 | 9.91 | 6.57 | -77% |
| 🇰🇪 Kenya | 49.47 | 43.52 | 27.68 | -44% |
| 🇲🇾 Malaysia | 44.31 | 27.89 | 15.24 | -66% |
| 🇲🇽 Mexico | 49.31 | 29.30 | 14.86 | -70% |
| 🇲🇦 Morocco | 51.08 | 29.23 | 17.55 | -66% |
| 🇲🇿 Mozambique | 46.66 | 46.38 | 36.60 | -22% |
| 🇲🇲 Myanmar | 45.58 | 27.48 | 17.10 | -62% |
| 🇳🇵 Nepal | 47.06 | 38.11 | 20.40 | -57% |
| 🇳🇬 Nigeria | 45.61 | 43.79 | 37.12 | -19% |
| 🇵🇰 Pakistan | 43.72 | 43.15 | 27.52 | -37% |
| 🇵🇪 Peru | 48.16 | 30.90 | 17.62 | -63% |
| 🇵🇭 Philippines | 49.84 | 33.26 | 21.81 | -56% |
| 🇵🇱 Poland | 30.85 | 14.28 | 9.49 | -69% |
| 🇷🇺 Russia | 28.80 | 13.52 | 9.64 | -67% |
| 🇸🇦 Saudi Arabia | 53.34 | 34.41 | 17.47 | -67% |
| 🇿🇦 South Africa | 41.65 | 31.15 | 19.82 | -52% |
| 🇰🇷 South Korea | 40.03 | 15.69 | 5.58 | -86% |
| 🇪🇸 Spain | 20.01 | 10.30 | 7.55 | -62% |
| 🇸🇩 Sudan | 47.75 | 43.09 | 33.60 | -30% |
| 🇹🇿 Tanzania | 47.75 | 43.78 | 36.21 | -24% |
| 🇹🇭 Thailand | 43.84 | 19.73 | 9.00 | -79% |
| 🇹🇷 Türkiye | 46.39 | 25.87 | 14.68 | -68% |
| 🇺🇸 U.S. | 22.81 | 16.73 | 11.06 | -52% |
| 🇺🇬 Uganda | 52.42 | 51.37 | 36.80 | -30% |
| 🇬🇧 UK | 16.44 | 13.88 | 10.08 | -39% |
| 🇺🇦 Ukraine | 22.95 | 12.76 | 7.72 | -66% |
| 🇺🇿 Uzbekistan | 39.85 | 33.98 | 23.55 | -41% |
| 🇻🇳 Vietnam | 38.82 | 28.51 | 15.01 | -61% |
| 🇾🇪 Yemen | 52.59 | 50.64 | 30.54 | -42% |
Every country on the list has seen a decline in birth rates in the last 70 years, with some declines more staggering than others. For example, China recorded 41 births per 1,000 people in 1950. By 2021, that number had fallen to just 7.6, a 81% decrease.
South Korea, the 29th most populous country in the world in 2021, saw an even larger 86% drop in its birth rate since 1950. In fact, almost every single country in this dataset has seen a double-digit fall in their birth rates over the past 70 years. Only the Democratic Republic of Congo has seen a single-digit percentage decline between 1950 and 2021.
Why are Global Birth Rates Falling?
For the 49 most populated countries in 2021, birth rates have halved on average in the last 70 years:
| 49 Most Populated Countries | 1950 | 1990 | 2021 |
|---|---|---|---|
| Average Birth Rate | 40.99 | 30.18 | 19.50 |
| Median Birth Rate | 45.73 | 30.76 | 17.10 |
But while the thought of a shrinking world population may seem worrisome, declining birth rates are generally thought of as a triumph of rapid socio-economic development.
As countries progress and living standards improve, there is a shift in societal norms and aspirations. For example, expanded education and career opportunities for women allow the pursuit of professional growth and personal goals, with some women choosing to delay starting a family or having smaller families.
Growing urbanization is another key driver of declining birth rates, characterized by smaller living spaces, increased focus on careers, and limited support networks. Another is the growing access to family planning services and contraceptives, particularly since the 1970s.
What are the Future Consequences?
The biggest consequence of declining birth rates—and one that is already being seen in many parts of the world—is a rapidly aging population.
With fewer children being born, the proportion of elderly individuals increases relative to the working-age population. This demographic imbalance poses challenges for social welfare systems, healthcare, and pension schemes.
Declining birth rates can also impact the labor market and economic productivity. A smaller workforce may lead to labor shortages, skill gaps, and reduced innovation. And shrinking populations reduce consumer demand, a cornerstone of the global economy, which may trigger a restructure of the current growth model of development.

-

 Real Estate2 weeks ago
Visualizing 1 Billion Square Feet of Empty Office Space
-
 Energy4 weeks ago
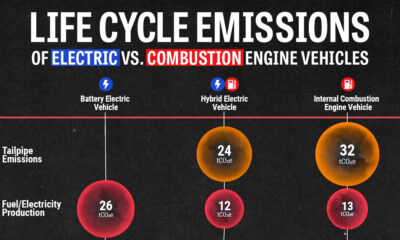
Life Cycle Emissions: EVs vs. Combustion Engine Vehicles
-

 Maps2 weeks ago
Vintage Viz: The World’s Rivers and Lakes, Organized Neatly
-

 Finance3 weeks ago
Visualized: The 100 Largest U.S. Banks by Consolidated Assets
-

 Technology1 week ago
Charted: Changing Sentiments Towards AI in the Workplace
-

 VC+3 weeks ago
What are Top Investment Managers Holding in Their Portfolios?
-

 Markets1 week ago
The 50 Best One-Year Returns on the S&P 500 (1980-2022)
-

 United States3 weeks ago
Chart: U.S. Home Price Growth Over 50 Years