Markets
Ranked: The Most Profitable U.S. Companies, by Sector
Subscribe to the Advisor Channel free mailing list for more like this
The Most Profitable U.S. Companies, by Sector
This was originally posted on Advisor Channel. Sign up to the free mailing list to get beautiful visualizations on financial markets that help advisors and their clients.
U.S. corporate profits hit record levels in 2022, even as stocks fell into a bear market and inflation reached 40-year highs.
Given these headwinds, investors are watching corporate fundamentals very closely. Corporate profit margins provide a buffer against higher borrowing costs and price pressures and for many reasons, they are a key measure of financial health.
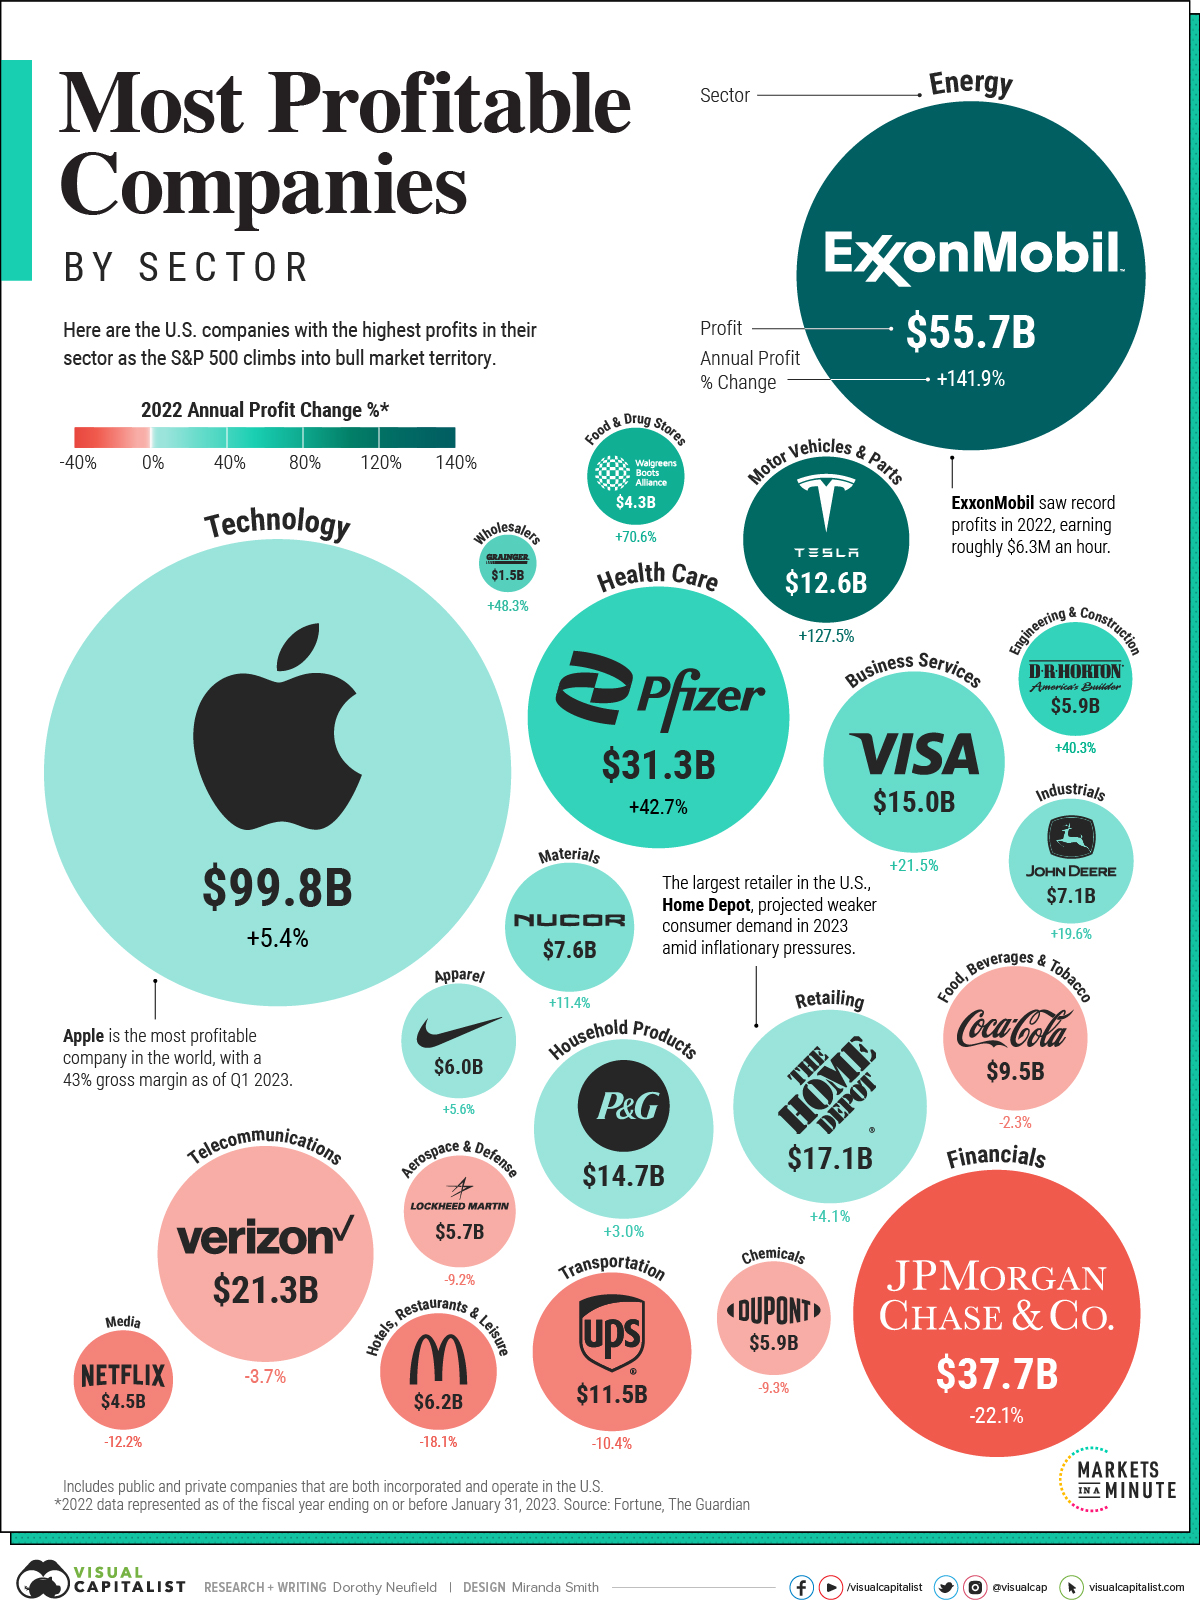
This graphic shows America’s most profitable companies by sector, using data from Fortune.
America’s Most Profitable Companies
Here are the U.S. firms with the highest annual profits in their sector. Data is based on the fiscal year ending on or before January 31, 2023 across companies in the Fortune 500.
Both public and private companies that are incorporated and operate in the U.S. are included.
| Name | Sector | 2022 Annual Profit | Annual % Change |
|---|---|---|---|
| Apple | Technology | $99.8B | 5.4% |
| Exxon Mobil | Energy | $55.7B | 141.9% |
| JPMorgan Chase | Financials | $37.7B | -22.1% |
| Pfizer | Health Care | $31.3B | 42.7% |
| Verizon Communications | Telecommunications | $21.3B | -3.7% |
| Home Depot | Retailing | $17.1B | 4.1% |
| Visa | Business Services | $15.0B | 21.5% |
| Procter & Gamble | Household Products | $14.7B | 3.0% |
| Tesla | Motor Vehicles & Parts | $12.6B | 127.5% |
| UPS | Transportation | $11.5B | -10.4% |
| Coca-Cola | Food, Beverages & Tobacco | $9.5B | -2.3% |
| Nucor | Materials | $7.6B | 11.4% |
| Deere | Industrials | $7.1B | 19.6% |
| McDonald's | Hotels, Restaurants & Leisure | $6.2B | -18.1% |
| Nike | Apparel | $6.0B | 5.6% |
| DuPont | Chemicals | $5.9B | -9.3% |
| D.R. Horton | Engineering & Construction | $5.9B | 40.3% |
| Lockheed Martin | Aerospace & Defense | $5.7B | -9.2% |
| Netflix | Media | $4.5B | -12.2% |
| Walgreens Boots Alliance | Food & Drug Stores | $4.3B | 70.6% |
| W.W. Grainger | Wholesalers | $1.5B | 48.3% |
Apple is the most profitable company in America. Reaching almost $100 billion in profits in 2022, it outpaces the profit leaders in both the energy and financials sectors combined. Furthermore, at the end of 2022, its net profit margin stood at nearly 25%.
Amid a maturing smartphone market, the company is focusing more on service-based revenue. iPhones make up roughly half of its total net sales, yet growth is plateauing. Last year, iPhone sales growth was 7%, compared to 39% the year before. Meanwhile, services sales—including cloud, AppleCare, and advertising—increased 14% annually.
Within the energy sector, Exxon Mobil took the top spot with record profits of over $55 billion. Profits jumped almost 142% last year as oil prices spiked with Russia’s invasion of Ukraine. Steep cuts in costs through the pandemic also helped to bolster the company’s returns.
JPMorgan Chase saw the highest profits in the financial sector. As the nation’s largest bank by assets, it saw a sharp decline in its investment banking division as higher interest rates made financing mergers and acquisitions less lucrative. Overall, profits sank more than 22% annually.
Corporate Profits in Perspective
Low taxes and interest rates contributed to about one-third of profit growth across nonfinancial companies in the S&P 500 over the last 20 years, a paper from the Federal Reserve shows.
Now, as interest rates climb higher, steeper costs could cut into bottom lines. The good news is so far, corporations have shown resilience to a shifting interest rate regime. In the first quarter of 2023, U.S. corporate profits fell moderately by just over 5%.
Profitability and Competitive Advantage
What does this mean for investors?
For investors looking for companies that can weather higher rates, profitability is one factor to consider. Companies with strong profitability can reinvest in their business, pay dividends, and better withstand road bumps from rising costs.
Going further, companies with high profitability often have a strong market share thanks to economies of scale lowering costs, brand loyalty driving demand, and economic moats. We can see this with Apple and Visa, for example.
Over time, this builds a sustainable competitive advantage. As companies preserve profitability, it adds value to shareholders, often supporting share prices over the longer-term.


Markets
The 50 Best One-Year Returns on the S&P 500 (1980-2022)
The highest one-year return among the top S&P 500 stocks from 1980 to 2022 was a staggering 2,620%. Which stocks top the ranks?
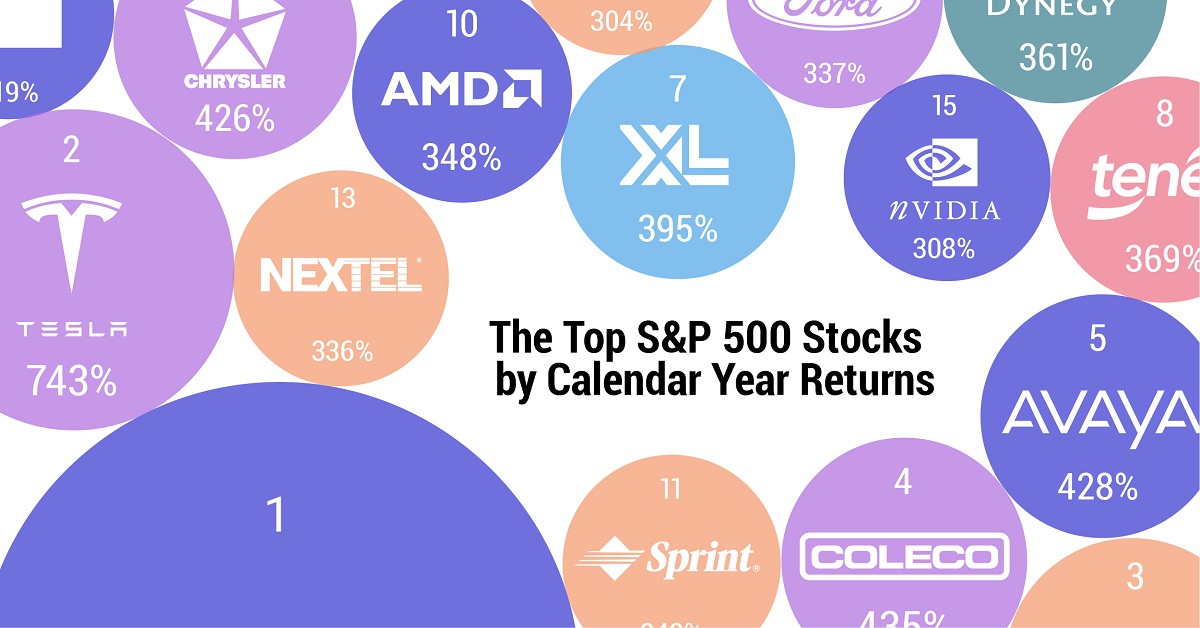
The Top S&P 500 Stocks by Annual Returns
The average annual return of the S&P 500 was 10% from 1980-2022, excluding dividends. Of course, there are some companies that deliver much higher returns in any given year.
In this graphic using data from S&P Dow Jones Indices, we explore the top S&P 500 stocks with the best single year returns over the last four decades.
Ranking the Top S&P 500 Stocks
In order to find the top gainers, S&P took the top 10 best-performing stocks each year and then narrowed that list down to the top 50 overall. They ranked the top S&P 500 stocks by price returns, meaning that no dividends or stock distributions were included.
The best gains were clustered in a few select years, including the 1999 dot-com boom, the 2003 stock market rally, and the 2009 recovery from the Global Financial Crisis. None of the biggest gains happened in 2021 or 2022.
| Rank | Company | Sector | Return | Year |
|---|---|---|---|---|
| 1 | Qualcomm | Information Technology | 2620% | 1999 |
| 2 | Tesla | Consumer Discretionary | 743% | 2020 |
| 3 | DSC Communications | Communication Services | 468% | 1992 |
| 4 | Coleco Industries | Consumer Discretionary | 435% | 1982 |
| 5 | Avaya | Information Technology | 428% | 2003 |
| 6 | Chrysler | Consumer Discretionary | 426% | 1982 |
| 7 | XL Capital (Axa XL) | Financials | 395% | 2009 |
| 8 | Tenet Healthcare | Healthcare | 369% | 2009 |
| 9 | Dynegy | Utilities | 361% | 2000 |
| 10 | Advanced Micro Devices | Information Technology | 348% | 2009 |
| 11 | Sprint | Communication Services | 343% | 1999 |
| 12 | Ford | Consumer Discretionary | 337% | 2009 |
| 13 | NEXTEL Communications | Communication Services | 336% | 1999 |
| 14 | LSI Logic | Information Technology | 319% | 1999 |
| 15 | NVIDIA | Information Technology | 308% | 2001 |
| 16 | Nortel Networks | Communication Services | 304% | 1999 |
| 17 | Etsy | Consumer Discretionary | 302% | 2020 |
| 18 | Genworth Financial | Financials | 301% | 2009 |
| 19 | Micron Technology | Information Technology | 300% | 2009 |
| 20 | NetFlix | Communication Services | 298% | 2013 |
| 21 | Oracle | Information Technology | 290% | 1999 |
| 22 | Western Digital | Information Technology | 286% | 2009 |
| 23 | Network Appliance (NetApp) | Information Technology | 270% | 1999 |
| 24 | Data General | Information Technology | 267% | 1991 |
| 25 | Yahoo | Communication Services | 265% | 1999 |
| 26 | Williams Companies | Energy | 264% | 2003 |
| 27 | Novell | Information Technology | 264% | 1991 |
| 28 | Dynegy | Utilities | 263% | 2003 |
| 29 | Sun Microsystems | Information Technology | 262% | 1999 |
| 30 | PMC-Sierra | Information Technology | 262% | 2003 |
| 31 | Advanced Micro Devices | Information Technology | 259% | 1991 |
| 32 | Dell | Information Technology | 248% | 1998 |
| 33 | Global Marine | Energy | 247% | 1980 |
| 34 | Micron Technology | Information Technology | 243% | 2013 |
| 35 | Best Buy | Consumer Discretionary | 237% | 2013 |
| 36 | Reebok | Consumer Discretionary | 234% | 2000 |
| 37 | Freeport-McMoRan | Materials | 229% | 2009 |
| 38 | Biomet (Zimmer Biomet) | Healthcare | 226% | 1991 |
| 39 | NVIDIA | Information Technology | 224% | 2016 |
| 40 | Gap | Consumer Discretionary | 223% | 1991 |
| 41 | NetFlix | Communication Services | 219% | 2010 |
| 42 | Fleetwood Enterprises (Fleetwood RV) | Consumer Discretionary | 217% | 1982 |
| 43 | National Semiconductor | Information Technology | 217% | 1999 |
| 44 | Dell | Information Technology | 216% | 1997 |
| 45 | Tandy Corp (RadioShack) | Information Technology | 216% | 1980 |
| 46 | Novell | Information Technology | 215% | 2003 |
| 47 | Corning | Information Technology | 215% | 2003 |
| 48 | CB Richard Ellis (CBRE) | Real Estate | 214% | 2009 |
| 49 | AES Corp | Utilities | 213% | 2003 |
| 50 | Expedia | Consumer Discretionary | 212% | 2009 |
Qualcomm was by far the top-performer in any one calendar year window. The company had key patents for Code Division Multiple Access (CDMA) technology, which enabled fast wireless internet access and became the basis for 3G networks.
Its stock took off in 1999 as it shed less profitable business lines, resolved a patent dispute with competitor Ericsson, and joined the S&P 500 Index. At the time, CNN reported that one lucky investor who heard about Qualcomm from an investment-banker-turned-rabbi earned $17 million—roughly $30 million in today’s dollars.
The most recent stocks to make the rankings were both from 2020: well-known Tesla (#2) and lesser-known online marketplace Etsy (#17), which saw sales from independent creators surge during the early COVID-19 pandemic. The dollar value of items sold on Etsy more than doubled from $5.3 billion in 2019 to $10.3 billion in 2020, with mask sales accounting for 7% of the total.
Biggest Gainers in Each Sector
While information technology stocks made up nearly half of the list, there is representation from nine of the 11 S&P 500 sectors. No companies from the Industrials or Consumer Staples sectors made it into the ranks of the top S&P 500 stocks by annual returns.
Below, we show the stock with the best annual return for each sector.
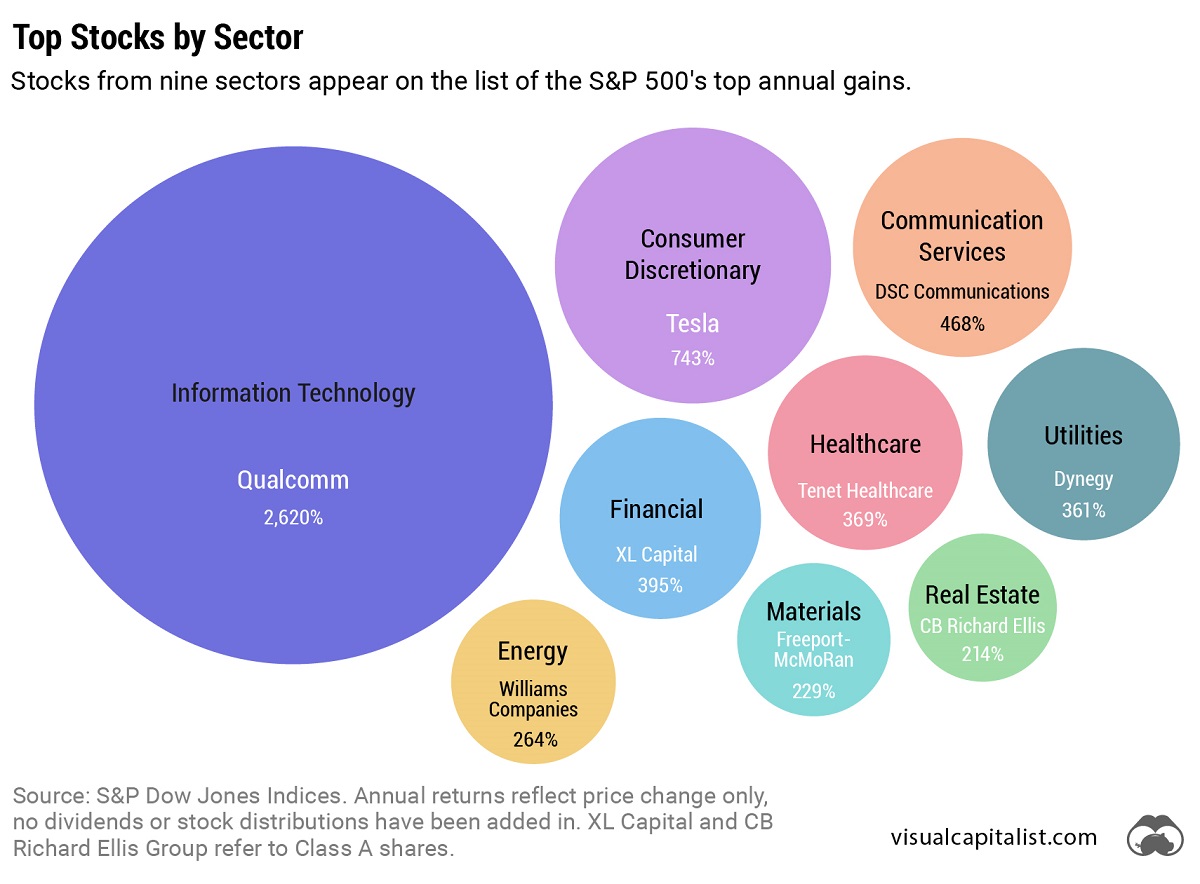
Tesla was the top-performing Consumer Discretionary stock on the list. After meeting the requirement of four consecutive quarters of positive earnings, it joined the S&P 500 Index on December 21, 2020. The company’s performance was boosted by the announcement that it would be included in the S&P 500, along with strong performance in China, and general EV buzz as environmental regulations tightened worldwide.
In the realm of Communication Services, DSC Communications saw a sizable return in 1992. The telecommunications equipment company had contracts with major companies such as Bell and Motorola. Alcatel-Lucent (then Alcatel), a French producer of mobile phones, purchased DSC Communications in 1998.
Serial Success Stories
It’s impressive to make the list of the top S&P 500 stocks by calendar returns once, but there are seven companies that have done it twice.
Some stocks saw their repeated outperformance close together, with Dell making the ranks back-to-back in 1997 and 1998.
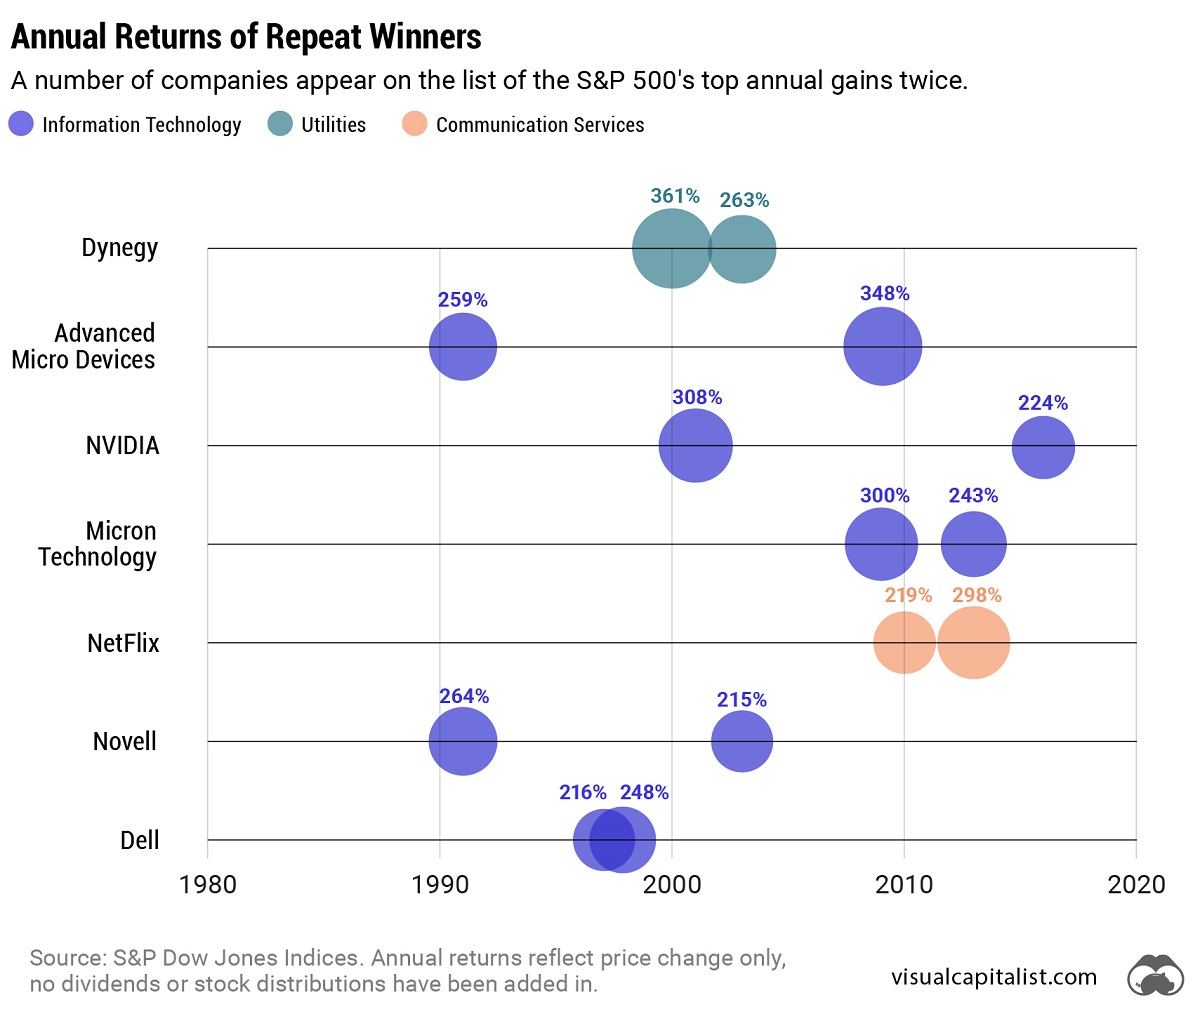
On the other hand, a select few have more staying power. Computing giant NVIDIA topped the charts in 2001 and triumphed again 15 years later in 2016. And this year might be another win, as the company has recently reached a $1 trillion market capitalization and has the highest year-to-date return in the S&P 500 as of July 6, 2023.
-
 Brands2 weeks ago
Brand Reputations: Ranking the Best and Worst in 2023
-
 Environment5 days ago
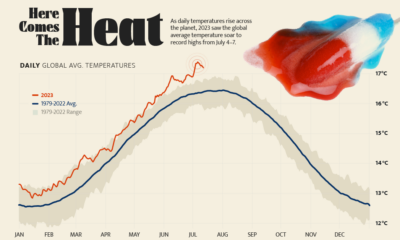
Hotter Than Ever: 2023 Sets New Global Temperature Records
-
 Markets4 weeks ago
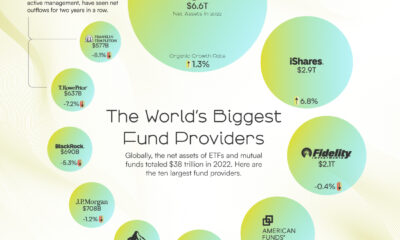
The World’s Biggest Mutual Fund and ETF Providers
-
 Energy2 weeks ago
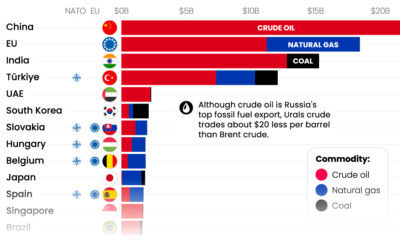
Who’s Still Buying Russian Fossil Fuels in 2023?
-

 VC+4 days ago
What’s New on VC+ in July
-

 Datastream4 weeks ago
Can You Calculate Your Daily Carbon Footprint?
-

 apps2 weeks ago
Meet the Competing Apps Battling for Twitter’s Market Share
-
 Politics17 hours ago
How Do Chinese Citizens Feel About Other Countries?