Mining
Charted: 30 Years of Central Bank Gold Demand
![]() Subscribe to the Elements free mailing list for more like this
Subscribe to the Elements free mailing list for more like this
30 Years of Central Bank Gold Demand
This was originally posted on Elements. Sign up to the free mailing list to get beautiful visualizations on natural resource megatrends in your email every week.
Did you know that nearly one-fifth of all the gold ever mined is held by central banks?
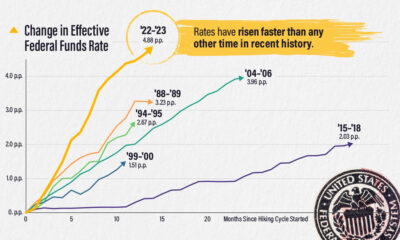
Besides investors and jewelry consumers, central banks are a major source of gold demand. In fact, in 2022, central banks snapped up gold at the fastest pace since 1967.
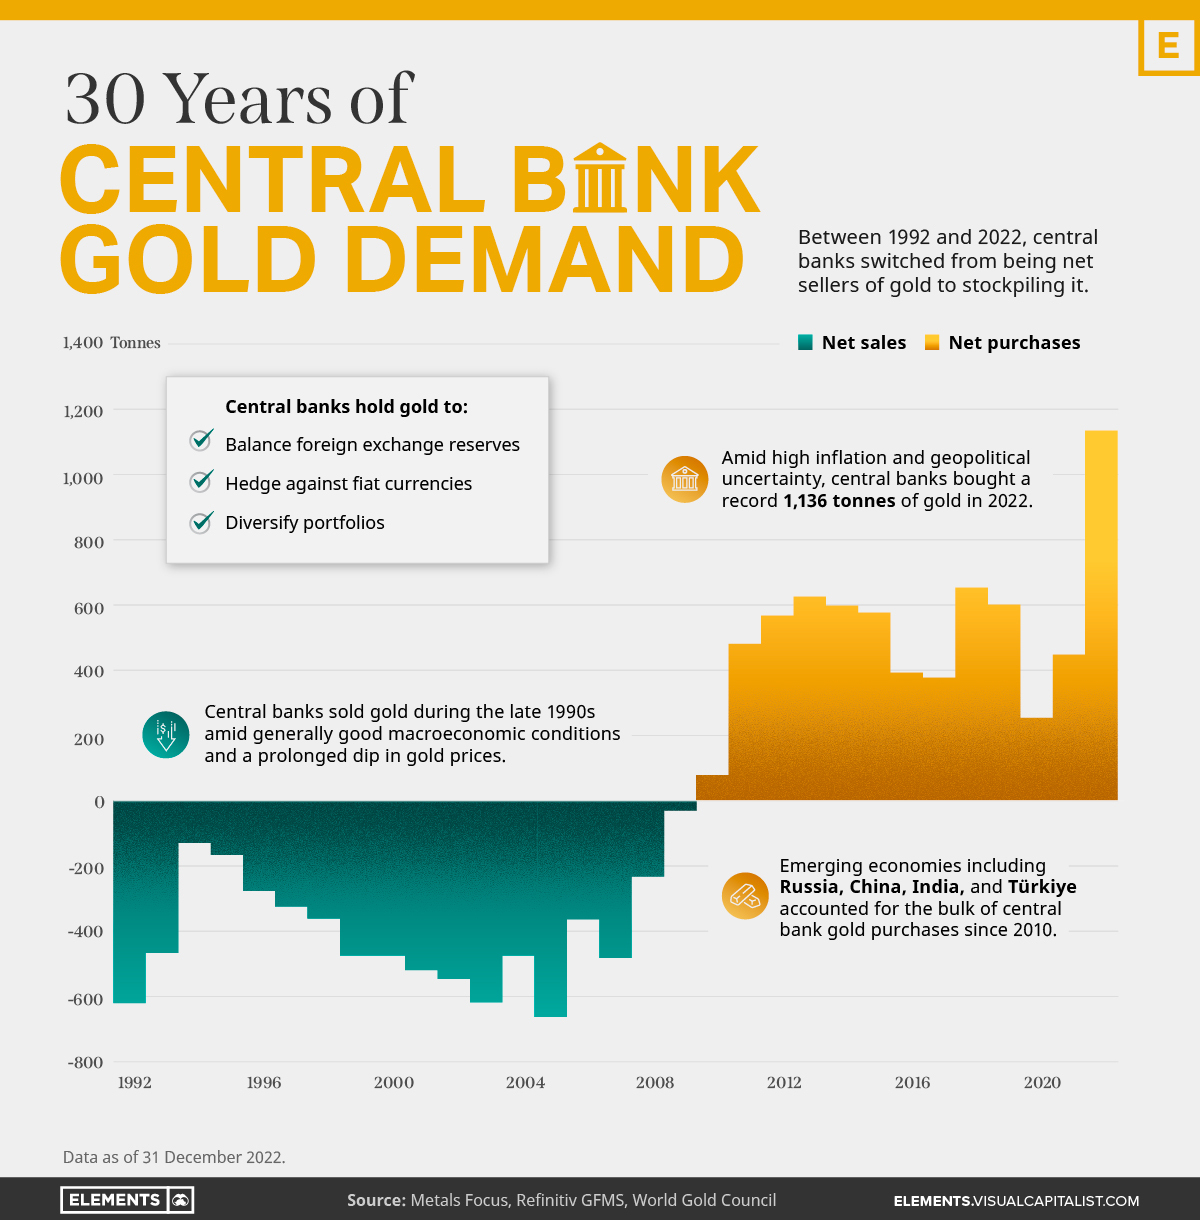
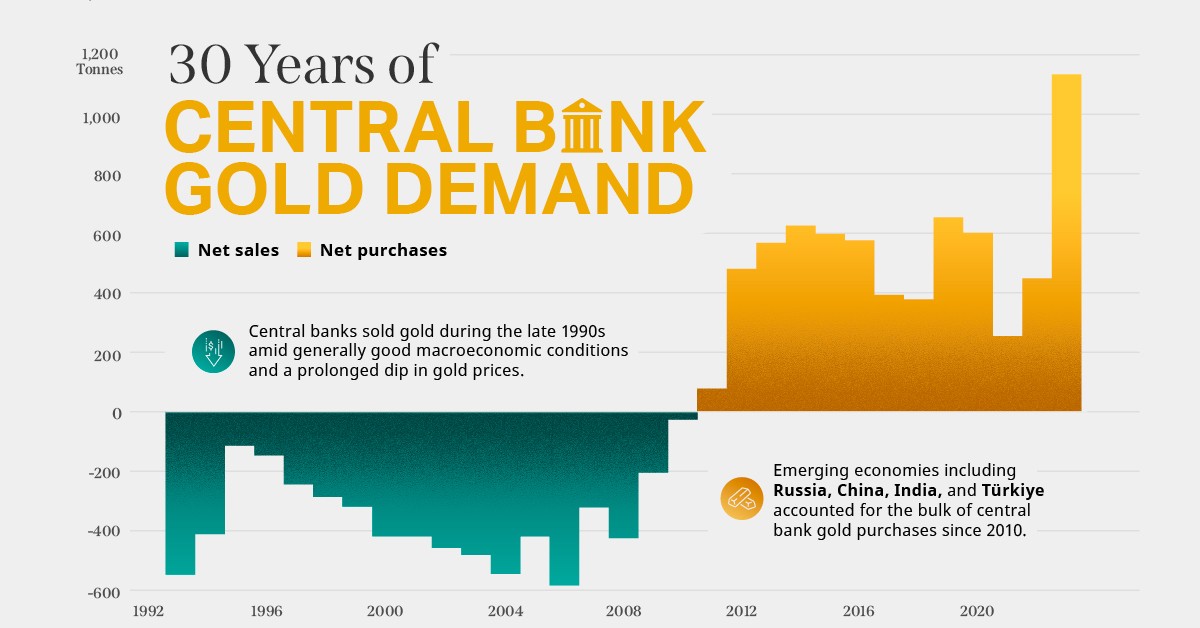
However, the record gold purchases of 2022 are in stark contrast to the 1990s and early 2000s, when central banks were net sellers of gold.
The above infographic uses data from the World Gold Council to show 30 years of central bank gold demand, highlighting how official attitudes toward gold have changed in the last 30 years.
Why Do Central Banks Buy Gold?
Gold plays an important role in the financial reserves of numerous nations. Here are three of the reasons why central banks hold gold:
- Balancing foreign exchange reserves
Central banks have long held gold as part of their reserves to manage risk from currency holdings and to promote stability during economic turmoil. - Hedging against fiat currencies
Gold offers a hedge against the eroding purchasing power of currencies (mainly the U.S. dollar) due to inflation. - Diversifying portfolios
Gold has an inverse correlation with the U.S. dollar. When the dollar falls in value, gold prices tend to rise, protecting central banks from volatility.
The Switch from Selling to Buying
In the 1990s and early 2000s, central banks were net sellers of gold.
There were several reasons behind the selling, including good macroeconomic conditions and a downward trend in gold prices. Due to strong economic growth, gold’s safe-haven properties were less valuable, and low returns made it unattractive as an investment.
Central bank attitudes toward gold started changing following the 1997 Asian financial crisis and then later, the 2007–08 financial crisis. Since 2010, central banks have been net buyers of gold on an annual basis.
Here’s a look at the 10 largest official buyers of gold from the end of 1999 to end of 2021:
| Rank | Country | Amount of Gold Bought (tonnes) | % of All Buying |
|---|---|---|---|
| #1 | 🇷🇺 Russia | 1,888 | 28% |
| #2 | 🇨🇳 China | 1,552 | 23% |
| #3 | 🇹🇷 Türkiye | 541 | 8% |
| #4 | 🇮🇳 India | 395 | 6% |
| #5 | 🇰🇿 Kazakhstan | 345 | 5% |
| #6 | 🇺🇿 Uzbekistan | 311 | 5% |
| #7 | 🇸🇦 Saudi Arabia | 180 | 3% |
| #8 | 🇹🇭 Thailand | 168 | 2% |
| #9 | 🇵🇱 Poland | 128 | 2% |
| #10 | 🇲🇽 Mexico | 115 | 2% |
| Total | 5,623 | 84% |
Source: IMF
The top 10 official buyers of gold between end-1999 and end-2021 represent 84% of all the gold bought by central banks during this period.
Russia and China—arguably the United States’ top geopolitical rivals—have been the largest gold buyers over the last two decades. Russia, in particular, accelerated its gold purchases after being hit by Western sanctions following its annexation of Crimea in 2014.
Interestingly, the majority of nations on the above list are emerging economies. These countries have likely been stockpiling gold to hedge against financial and geopolitical risks affecting currencies, primarily the U.S. dollar.
Meanwhile, European nations including Switzerland, France, Netherlands, and the UK were the largest sellers of gold between 1999 and 2021, under the Central Bank Gold Agreement (CBGA) framework.
Which Central Banks Bought Gold in 2022?
In 2022, central banks bought a record 1,136 tonnes of gold, worth around $70 billion.
| Country | 2022 Gold Purchases (tonnes) | % of Total |
|---|---|---|
| 🇹🇷 Türkiye | 148 | 13% |
| 🇨🇳 China | 62 | 5% |
| 🇪🇬 Egypt | 47 | 4% |
| 🇶🇦 Qatar | 33 | 3% |
| 🇮🇶 Iraq | 34 | 3% |
| 🇮🇳 India | 33 | 3% |
| 🇦🇪 UAE | 25 | 2% |
| 🇰🇬 Kyrgyzstan | 6 | 1% |
| 🇹🇯 Tajikistan | 4 | 0.4% |
| 🇪🇨 Ecuador | 3 | 0.3% |
| 🌍 Unreported | 741 | 65% |
| Total | 1,136 | 100% |
Türkiye, experiencing 86% year-over-year inflation as of October 2022, was the largest buyer, adding 148 tonnes to its reserves. China continued its gold-buying spree with 62 tonnes added in the months of November and December, amid rising geopolitical tensions with the United States.
Overall, emerging markets continued the trend that started in the 2000s, accounting for the bulk of gold purchases. Meanwhile, a significant two-thirds, or 741 tonnes of official gold purchases were unreported in 2022.
According to analysts, unreported gold purchases are likely to have come from countries like China and Russia, who are looking to de-dollarize global trade to circumvent Western sanctions.


Markets
How Big is the Market for Crude Oil?
The oil market is bigger than the 10 largest metal markets combined, with production value exceeding $2 trillion annually.

How Big is the Market for Crude Oil?
This was originally posted on Elements. Sign up to the free mailing list to get beautiful visualizations on real assets and resource megatrends each week.
While the global economy relies on many commodities, none come close to the massive scale of the crude oil market.
Besides being the primary energy source for transportation, oil is a key raw material for numerous other industries like plastics, fertilizers, cosmetics, and medicine. As a result, the global physical oil market is astronomical in size and has a significant economic and geopolitical influence, with a few countries dominating global oil production.
The above infographic puts crude oil’s market size into perspective by comparing it to the 10 largest metal markets combined. To calculate market sizes, we used the latest price multiplied by global production in 2022, based on data from TradingEconomics and the United States Geological Survey (USGS).
Note: This analysis focuses on raw and physical materials, excluding derivative markets and alloy materials like steel.
How Big Is the Oil Market?
In 2022, the world produced an average of 80.75 million barrels of oil per day (including condensates). That puts annual crude oil production at around 29.5 billion barrels, with the market size exceeding $2 trillion at current prices.
That figure dwarfs the combined size of the 10 largest metal markets:
| Commodity | 2022 Annual Production | Market Size |
|---|---|---|
| Crude Oil | 29.5 billion barrels | $2.1 trillion |
| Iron Ore | 2.6 billion tonnes | $283.4 billion |
| Gold | 3,100 tonnes | $195.9 billion |
| Copper | 22 million tonnes | $183.3 billion |
| Aluminum | 69 million tonnes | $152.6 billion |
| Nickel | 3.3 million tonnes | $68.8 billion |
| Zinc | 13 million tonnes | $30.9 billion |
| Silver | 26,000 tonnes | $19.9 billion |
| Molybdenum | 250,000 tonnes | $12.9 billion |
| Palladium | 210 tonnes | $9.5 billion |
| Lead | 4.5 million tonnes | $9.2 billion |
Based on prices as of June 7, 2023.
The combined market size of the top 10 metal markets amounts to $967 billion, less than half that of the oil market. In fact, even if we added all the remaining smaller raw metal markets, the oil market would still be far bigger.
This also reflects the massive scale of global oil consumption annually, with the resource having a ubiquitous presence in our daily lives.
The Big Picture
While the oil market towers over metal markets, it’s important to recognize that this doesn’t downplay the importance of these commodities.
Metals form a critical building block of the global economy, playing a key role in infrastructure, energy technologies, and more. Meanwhile, precious metals like gold and silver serve as important stores of value.
As the world shifts towards a more sustainable future and away from fossil fuels, it’ll be interesting to see how the markets for oil and other commodities evolve.
-
 Green5 days ago
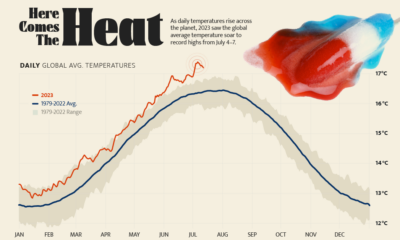
Hotter Than Ever: 2023 Sets New Global Temperature Records
-

 Datastream4 weeks ago
Can You Calculate Your Daily Carbon Footprint?
-
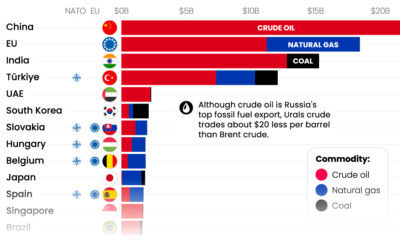
 Energy2 weeks ago
Who’s Still Buying Russian Fossil Fuels in 2023?
-

 VC+4 days ago
What’s New on VC+ in July
-

 Investor Education4 weeks ago
Visualizing BlackRock’s Top Equity Holdings
-

 Technology2 weeks ago
Meet the Competing Apps Battling for Twitter’s Market Share
-
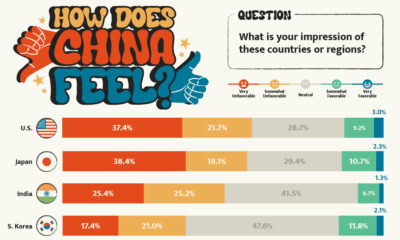
 Politics14 hours ago
How Do Chinese Citizens Feel About Other Countries?
-

 Markets4 weeks ago
Visualizing Every Company on the S&P 500 Index