Money
Comparing the Speed of Interest Rate Hikes (1988-2023)


Comparing the Speed of U.S. Interest Rate Hikes
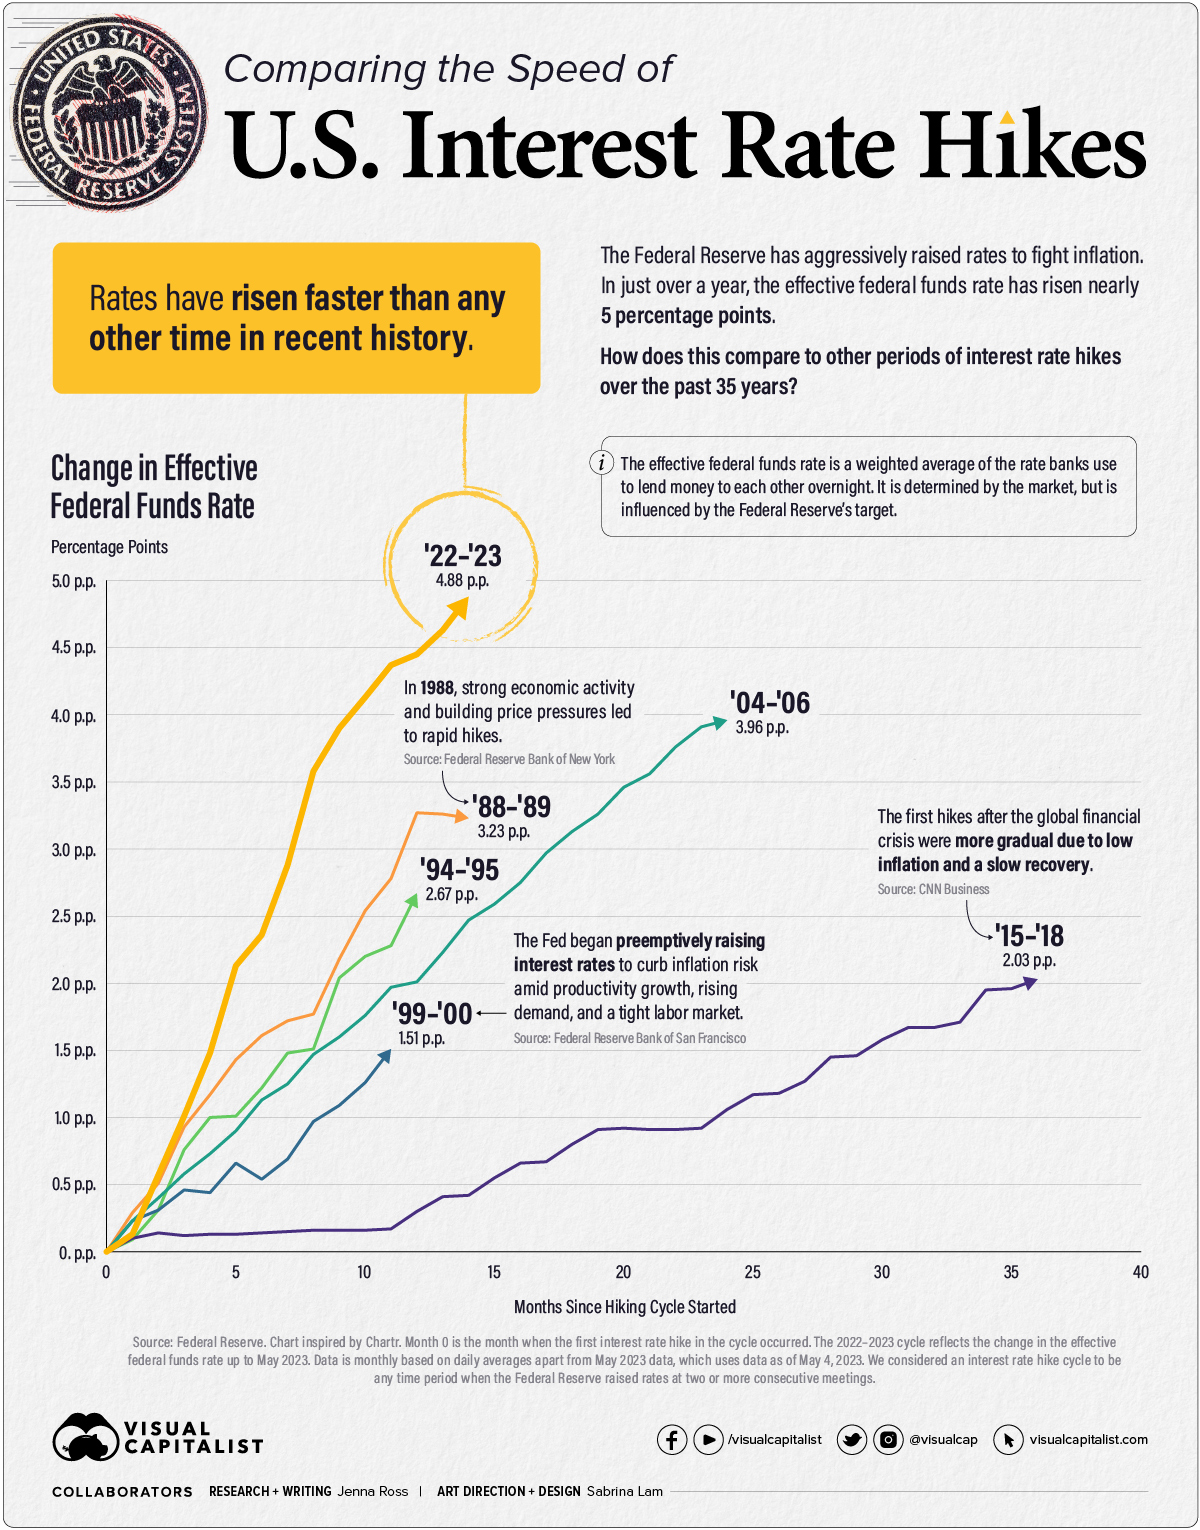
After the latest rate hike on May 3rd, U.S. interest rates have reached levels not seen since 2007. The Federal Reserve has been aggressive with its interest rate hikes as it tries to combat sticky inflation. In fact, rates have risen nearly five percentage points (p.p.) in just 14 months.
In this graphic—inspired by a chart from Chartr—we compare both the speed and severity of current interest rate hikes to other periods of monetary tightening over the past 35 years.
Measuring Periods of Interest Rate Hikes
We measured rate hike cycles with the effective federal funds rate (EFFR), which calculates the weighted average of the rates that banks use to lend to each other overnight. It is determined by the market but influenced by the Fed’s target range. We considered the starting point for each cycle to be the EFFR during the month when the first rate hike took place.
Here is the duration and severity of each interest rate hike cycle since 1988.
| Time Period | Duration (Months) | Total Change in EFFR (Percentage Points) |
|---|---|---|
| Mar 1988 - May 1989 | 14 | +3.23 |
| Feb 1994 - Feb 1995 | 12 | +2.67 |
| Jun 1999 - May 2000 | 11 | +1.51 |
| Jun 2004 - Jun 2006 | 24 | +3.96 |
| Dec 2015 - Dec 2018 | 36 | +2.03 |
| Mar 2022 - May 2023* | 14 | +4.88 |
*We considered a rate hike cycle to be any time period when the Federal Reserve raised rates at two or more consecutive meetings. The 2022-2023 rate hike cycle is ongoing, with the latest hike made on May 4, 2023.
When we last compared the speed of interest rate hikes in September 2022, the current cycle was the fastest but not the most severe. In the months since, the total rate change of 4.88 p.p. has surpassed that of the ‘04-‘06 rate hike cycle. During the ‘04-‘06 cycle, the Federal Reserve eventually decided to pause hikes due to moderate economic growth and contained inflation expectations.
On the other end of the scale, the slowest rate hike cycle occurred in ‘15-‘18 after the Global Financial Crisis. Inflation, as measured by the Personal Consumption Expenditures (PCE) Index, was a mere 0.30% when the first hike occurred. Meeting transcripts reveal that Federal Reserve officials were concerned they may be raising rates too early. However, they agreed to the small quarter percentage point increase to show unity with Fed Chair Janet Yellen, who believed rising oil prices would eventually lead to higher inflation.
End of a Cycle?
The Federal Reserve’s small quarter-point rate hike on May 3 was influenced by a variety of factors. Below is a look at how select indicators have shifted since the first hike occurred in March 2022.
| March 2022 | March 2023 | |
|---|---|---|
| Year-Over-Year Inflation | 6.8% | 4.2% |
| Annual Growth in Labor Costs | 4.5% | 4.8% |
| Inflation-Adjusted Growth in Labor Costs | -3.7% | -0.2% |
| Annualized GDP Growth | 7.0% | 1.1% |
| Unemployment Rate | 3.6% | 3.5% |
| Over-the-Month Change in Employment (Revised data post-rate hike decision in brackets) | +414,000 | +236,000 (+165,000) |
Source: Bureau of Labor Statistics, Bureau of Economic Analysis. Inflation is measured by the Personal Consumption Expenditures (PCE) Index. GDP growth for March 2022 is for Q4 2021, which is the data the Fed would have had access to when making its first rate hike decision. Employment has since grown by 253,000 in April 2023.
The unemployment rate remains low and job growth remains positive. Labor costs, in terms of wages and benefits, continue to grow. However, they are essentially flat on an inflation-adjusted basis. Inflation is still above the Federal Reserve’s 2% target, but it has slowed over the past year.
There are also reasons to be cautious. Economic growth has slowed considerably, and the Federal Reserve predicted in March of this year that a “mild recession” would begin later in 2023. Turbulence in the banking sector is also cause for concern, as tighter credit conditions will likely weigh on economic activity.
For now, it seems the Fed may have pressed pause on future interest rate hikes. Its latest statement said it would “determine the extent to which additional policy firming may be appropriate” rather than previous statements which anticipated future hikes.


Politics
Animated: Change in Russian Billionaires’ Wealth Since 2022
How have Russian billionaires fared since Russia’s invasion of Ukraine? This animation tracks the wealth of 22 Russian billionaires.
 Creator Program
Animated: Change in Russian Billionaires’ Wealth Since 2022
When Russia invaded Ukraine in February 2022, many countries retaliated with sanctions targeting Russian billionaires—the oligarchs—and politicians directly.
And as the war has progressed, those sanctions have intensified, with even the relatives and shell companies of these billionaires being targeted over time. The reason? These oligarchs are interconnected to Russia’s government, lending vocal and fiscal support in exchange for sweetheart deals or beneficial government oversight.
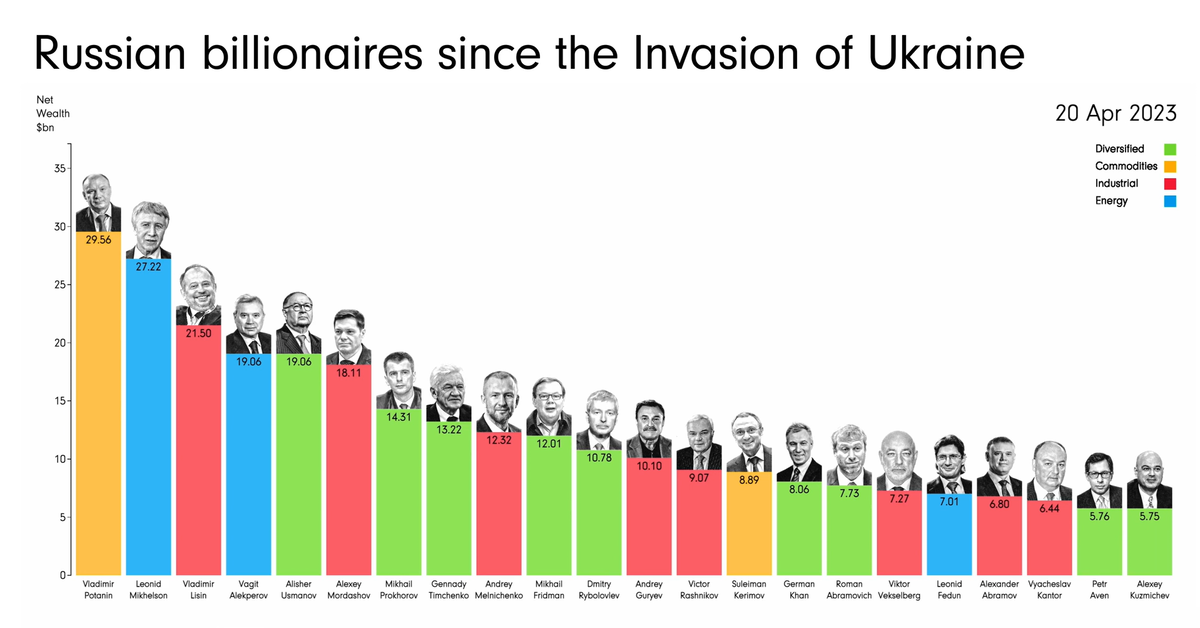
This animation from James Eagle shows how the estimated net wealth of the 22 wealthiest Russian billionaires on the Bloomberg Billionaires Index in April 2023 has changed since January 2022, prior to the start of the conflict.
Net Wealth of Top Russian Billionaires
The 22 wealthiest Russian billionaires in April 20, 2023 lost a collective $90.4 billion in net worth since January 5, 2022.
| Rank | Name | Main Industry | Net Wealth (Apr 20, 2023) | Net Wealth (Jan 5, 2022) | % Change |
|---|---|---|---|---|---|
| 1 | Vladimir Potanin | Commodities | $29.6B | $31.1B | -4.8% |
| 2 | Leonid Mikhelson | Energy | $27.2B | $33.2B | -18.1% |
| 3 | Vladimir Lisin | Industrial | $21.5B | $28.0B | -23.2% |
| 4 | Vagit Alekperov | Energy | $19.1B | $22.8B | -16.2% |
| 5 | Alisher Usmanov | Diversified | $19.1B | $21.2B | -9.9% |
| 6 | Alexey Mordashov | Industrial | $18.1B | $29.1B | -37.8% |
| 7 | Mikhail Prokhorov | Diversified | $14.3B | $14.0B | 2.1% |
| 8 | Gennady Timchenko | Diversified | $13.2B | $23.1B | -42.9% |
| 9 | Andrey Melnichenko | Industrial | $12.3B | $17.8B | -30.9% |
| 10 | Mikhail Fridman | Diversified | $12.0B | $14.1B | -14.9% |
| 11 | Dmitry Rybolovlev | Diversified | $10.8B | $11.2B | -3.6% |
| 12 | Andrey Guryev | Industrial | $10.1B | $8.0B | 26.3% |
| 13 | Victor Rashnikov | Industrial | $9.1B | $14.4B | -36.8% |
| 14 | Suleiman Kerimov | Commodities | $8.9B | $15.2B | -41.4% |
| 15 | German Khan | Diversified | $8.1B | $9.6B | -15.6% |
| 16 | Roman Abramovich | Diversified | $7.7B | $18.2B | -57.7% |
| 17 | Viktor Vekselberg | Industrial | $7.3B | $18.6B | -60.8% |
| 18 | Leonid Fedun | Energy | $7.0B | $8.9B | -21.3% |
| 19 | Alexander Abramov | Industrial | $6.8B | $9.1B | -25.3% |
| 20 | Vyacheslav Kantor | Industrial | $6.4B | $9.1B | -29.7% |
| 21 | Petr Aven | Diversified | $5.8B | $6.6B | -12.1% |
| 22 | Alexey Kuzmichev | Diversified | $5.8B | $7.3B | -20.5% |
The heaviest hit include Viktor Vekselberg, who holds a stake in UC Rusal, the world’s third largest aluminum producer. Since the start of the war, he’s lost an estimated $11.3 billion or 61% of his net worth from January 2022.
Roman Abramovich, who got his start in the early oligarchy through oil conglomerates, was also hit hard by the sanctions. He lost $10.5 billion or 58% of his net worth from January 2022, and was forced to sell Chelsea Football Club in one of the biggest sports team sales in history.
Notably, the richest oligarchs haven’t lost as much. Mining giant Norilsk Nickel’s largest shareholder, Vladimir Potanin, saw his net worth only drop by 4.8%. After being hit hard at the onset of the war in Ukraine, he quickly rebounded and at many times had an even higher net worth, reaching $35.6 billion in June 2022.
And a few oligarchs, like former Norilsk Nickel CEO Mikhail Prokhorov and phosphate-based fertilizer baron Andrey Guryev, saw their wealth increase since January 2022. Guryev grew his net worth by $2 billion or 26%, while Prokhorov (who formerly owned the NBA’s Brooklyn Nets) saw his net worth even out at a gain of $0.3 billion or 2%.
Oligarch Support of Russia (or Lack Thereof)
As Russia’s war with Ukraine has dragged on, and sanctions have continued to weigh on Russian billionaires, politicians, and companies, their effects have been uncertain.
Oligarchs have lost net worth, relinquished foreign businesses, and even had prized possessions like mansions and yachts seized. At the same time, though Russia’s economy has weakened under sanctions, bolstered trade with countries like China, India, and Saudi Arabia have kept it stronger than expected.
And though some oligarchs have voiced various concerns over the ongoing war, the wealthiest have been careful to toe the line. Russian billionaires and politicians that did vocalize criticism, including Lukoil chairman Ravil Maganov, have been found dead in apparent suicides, heart attacks, and accidents.
The most serious oligarch rebellion wasn’t due to economic hardships, but military operations. Oligarch and mercenary leader Yevgeny Prigozhin launched an attempted coup in June 2023, reportedly retreating after support from within Russia’s military quickly fizzled.

-
 Environment5 days ago
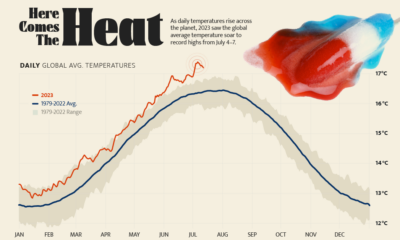
Hotter Than Ever: 2023 Sets New Global Temperature Records
-

 Datastream4 weeks ago
Can You Calculate Your Daily Carbon Footprint?
-
 Energy2 weeks ago
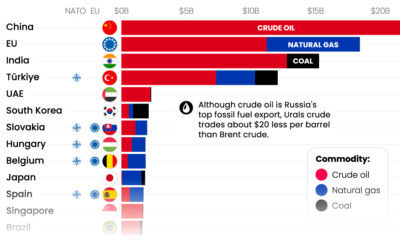
Who’s Still Buying Russian Fossil Fuels in 2023?
-

 VC+4 days ago
What’s New on VC+ in July
-

 Investor Education4 weeks ago
Visualizing BlackRock’s Top Equity Holdings
-
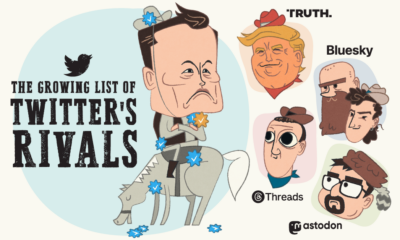
 apps2 weeks ago
Meet the Competing Apps Battling for Twitter’s Market Share
-
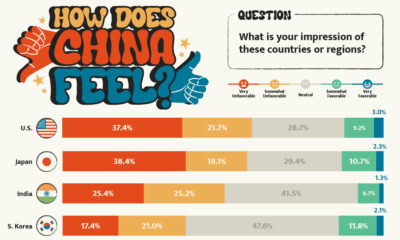
 Politics14 hours ago
How Do Chinese Citizens Feel About Other Countries?
-

 Markets4 weeks ago
Visualizing Every Company on the S&P 500 Index