Commodities
The Periodic Table of Commodity Returns (2013-2022)
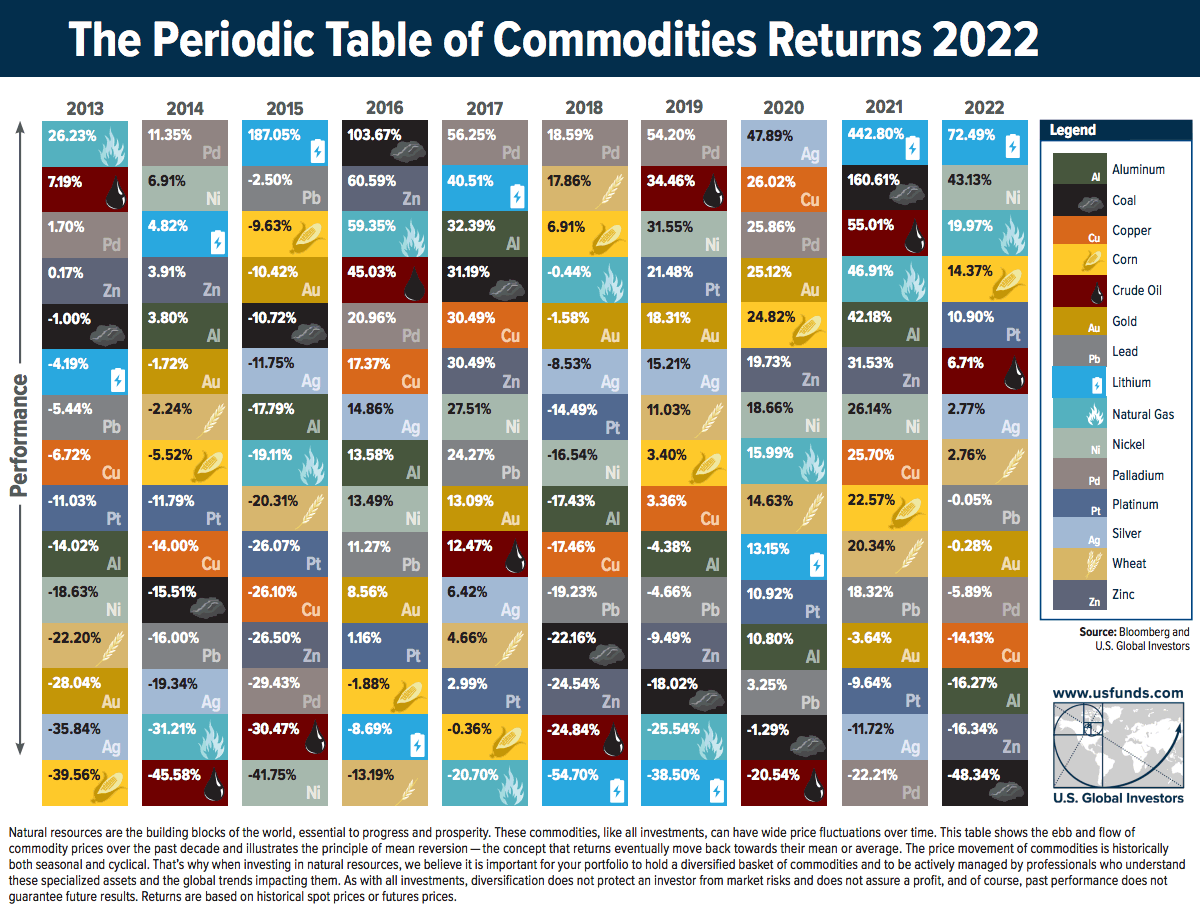
The Periodic Table of Commodity Returns (2013-2022)
Trying to predict which commodities will come out on top in any given year is tricky business—especially during this turbulent period in markets.
By looking back at previous years, investors can gain insights into long-term trends and patterns in commodity prices. To help better understand these trends, U.S. Global Investors releases a visualization called the Periodic Table of Commodity Returns at the outset of each year.
This year’s edition looks back over the past decade of returns between 2013 and 2022, and features an interactive design that allows users to sort returns by various categories including returns, volatility, and other groupings.
Editor’s note: Because of the Russia-Ukraine conflict, regional benchmarks for some commodities (coal, natural gas) had much bigger price divergences than is typical. In this case the graphic focuses in on U.S. regional benchmarks like Powder River Basin coal and Henry Hub natural gas prices. These prices may differ from price action seen around the world.
More Volatility, but Positive Returns
After 2021 saw an impressive surge in commodity prices as the world reopened post-pandemic, 2022 brought another year of positive returns for the asset class that were defined by high levels of volatility.
The broad-based S&P Goldman Sachs Commodity Index (GSCI) surged 52.1% in the first five months of 2022, as supply disruptions and fears across grains, metals, and energy fuels were spurred by Russia’s invasion of Ukraine.
The second half of the year saw prices cool as the U.S. continued to release crude oil from its strategic petroleum reserve while Russia and Ukraine established an agreement to enable grain and agricultural exports, quelling fears of extended supply disruptions.
The result? In the last seven months of the year the S&P GSCI nearly completed a return trip and only ended up rising 8.7% in 2022 overall.
| Commodity | 2022 Returns |
|---|---|
| Lithium | 72.49% |
| Nickel | 43.13% |
| Natural Gas (Henry Hub) | 19.97% |
| Corn | 14.37% |
| Platinum | 10.90% |
| S&P Goldman Sachs Commodity Index (GSCI) | 8.71% |
| Crude oil | 6.71% |
| Silver | 2.77% |
| Wheat | 2.76% |
| Lead | -0.05% |
| Gold | -0.28% |
| Palladium | -5.89% |
| Copper | -14.13% |
| Aluminum | -16.27% |
| Zinc | -16.34% |
| Coal (PRB) | -48.34% |
Another key factor that helped keep commodity prices cool in 2022 was China’s extended lockdowns which slowed down the country’s manufacturing and industrial capabilities. This helped reduce the demand of energy fuels in 2022, along with industrial metals like copper, aluminum, and zinc.
Lithium Continues to Top Commodity Returns
A metal that did shine brightly in 2022 was lithium, which has been newly added to the Periodic Table of Commodity Returns.
After topping the table in 2021 with an outsized price increase of 442.8%, lithium kept its top spot in 2022 with a more modest price increase of 72.5%.
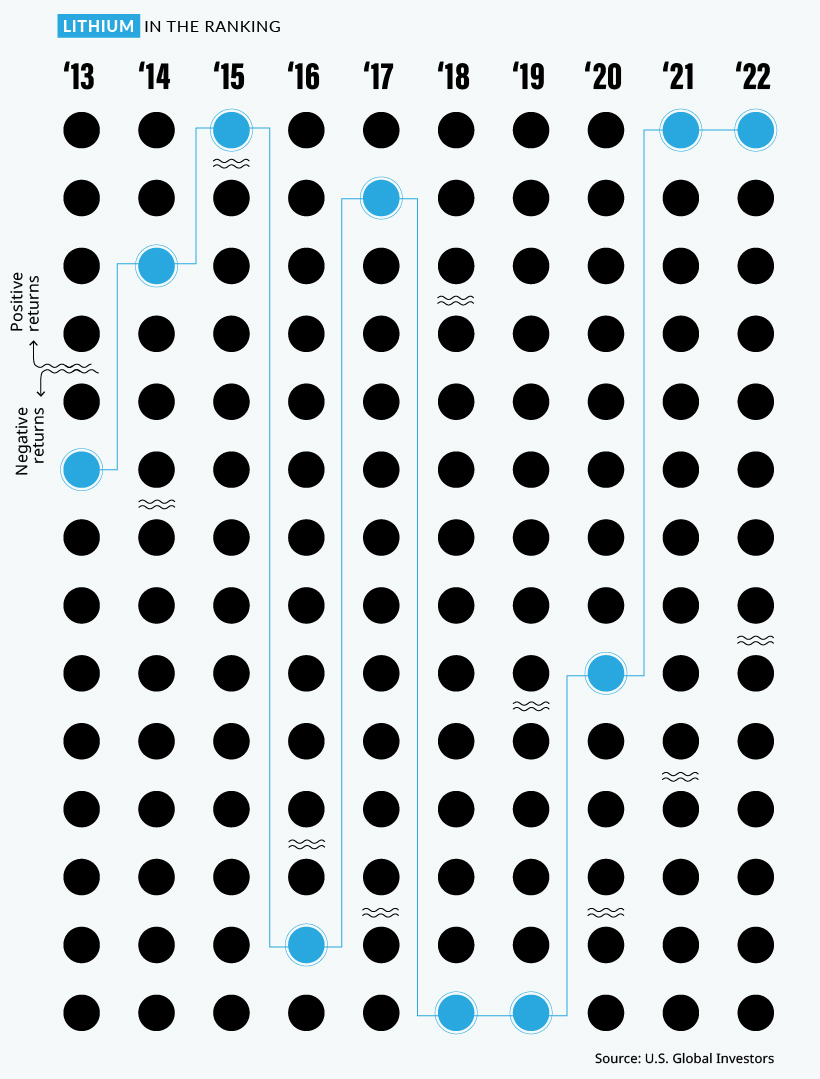
The growing global push towards electric vehicles (EVs) has been a major contributor to the increase in demand for lithium and nickel, which was the second-best performing commodity in 2022 with a price increase of 43.1%. As more countries set targets to phase out gasoline and diesel vehicles, demand for key battery minerals like lithium and nickel is expected to continue to rise.
While the U.S. is working to strengthen its battery metals production and supply chains with $2.8 billion in grants for domestic lithium, graphite, and nickel projects, it will be years before more supply comes online as a result. In the meantime, robust demand for EVs in China has provided a constant need for these battery metals which are currently in short supply.
Energy Price Variance Fueled by Regional Uncertainty
After 2021 saw energy fuels dominate the top spots after lithium, energy fuel prices in 2022 were more volatile with more scattered returns. Natural gas was the only fuel which saw double-digit returns at a 19.9%, with crude oil returning 6.7% and coal at the bottom of the table at -48.3%.
It’s important to keep in mind how geopolitical events and supply disruptions last year affected the regional price differences for energy fuels. While WTI crude oil (North America’s benchmark) increased by 6.7% in 2022, Brent crude oil (Europe’s benchmark) was up 10.4% as Urals crude oil (Russia’s benchmark) fell by more than 26.5%.
| Type of Crude Oil | 2022 Returns | Price in U.S. dollars (Jan 17, 2023) |
|---|---|---|
| Brent Crude Oil (European benchmark) | 10.35% | $86.72 |
| WTI Crude Oil (North American benchmark) | 6.72% | $81.01 |
| Urals Crude Oil (Russian benchmark) | -26.53% | $55.60 |
As a result of the war and ensuing sanctions, the discount of Urals crude oil compared to Brent crude oil went from -$1.72 at the start of 2022 all the way to -$30.71 by the end of the year.
Thermal coal prices faced similar regional divergences, with Powder River Basin (PRB) coal (America’s benchmark for coal) falling by 48.3% this year while Newcastle coal, which is delivered out of the port of Newcastle, Australia primarily to various Asian nations, saw prices skyrocket up by 156.6% in 2022.
After such a wild year with huge variance in commodity prices, we’ll see if 2023 can bring some stability or if high volatility and growing regional price discrepancies will become the norm.


Commodities
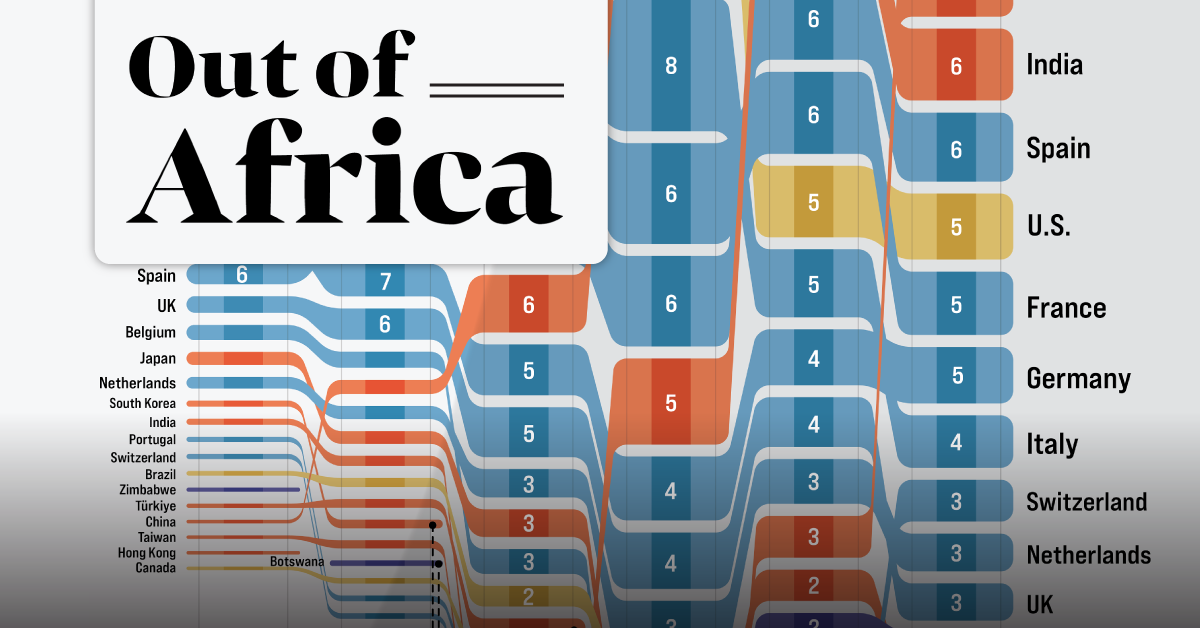
Charted: Top Destinations for Africa’s Exports (1995-2020)
In 2020 the African continent exported nearly $378 billion worth of goods. Here are the top destinations for 25 years of Africa’s exports.
 Creator Program
Charted: Top Destinations for Africa’s Exports (1995-2020)
Just under 30 years ago, exports originating from countries in Africa sat at $106 billion annually, primarily going to nations in the West. By 2020, Africa’s exports had more than tripled, but now with Asia as the primary destination.
The world’s second-largest continent, much of the value of Africa’s exports are concentrated in natural resources like petroleum, gold, diamonds, natural gas, and coal. Agricultural commodities like tea, coffee, and cotton also find large markets overseas.
Which countries are the top destinations for Africa’s exports?
This graphic from Sebastian Gräff uses data from Harvard University’s Atlas of Economic Complexity, the World Bank, and Bloomberg to track total exports from African countries over the years. Countries receiving a 1% or greater share of total exports have been included, and percentages have been rounded.
Tracking Africa’s Exports Between 1995 and 2005
The U.S. was the top destination for African goods for many years, led by the country’s demand for petroleum products. At its peak in 2005, the U.S. received one-fifth of the continent’s exports, valued at $55 billion.
Here’s a look at all the countries that had a 1% or greater share of Africa’s total export value at some point from 1995 to 2005.
| Country | Region | 1995 | 2000 | 2005 |
|---|---|---|---|---|
| 🇺🇸 U.S. | North America | 14% | 18% | 20% |
| 🇮🇹 Italy | Europe | 11% | 9% | 8% |
| 🇫🇷 France | Europe | 11% | 8% | 7% |
| 🇩🇪 Germany | Europe | 8% | 7% | 5% |
| 🇪🇸 Spain | Europe | 6% | 7% | 7% |
| 🇬🇧 UK | Europe | 5% | 6% | 5% |
| 🇧🇪 Belgium | Europe | 5% | 3% | 3% |
| 🇯🇵 Japan | Asia | 4% | 3% | 3% |
| 🇳🇱 Netherlands | Europe | 3% | 3% | 3% |
| 🇰🇷 South Korea | Asia | 2% | 2% | 1% |
| 🇮🇳 India | Asia | 2% | 2% | 1% |
| 🇵🇹 Portugal | Europe | 2% | 1% | 1% |
| 🇨🇳 China | Asia | 1% | 3% | 6% |
| 🇧🇷 Brazil | South America | 1% | 2% | 2% |
| 🇹🇷 Turkiye | Asia | 1% | 2% | 2% |
| 🇨🇦 Canada | North America | 1% | 1% | 2% |
| 🇨🇭 Switzerland | Europe | 1% | 1% | 1% |
| 🇿🇼 Zimbabwe | Africa | 1% | 1% | 1% |
| 🇹🇼 Taiwan | Asia | 1% | 2% | 1% |
| 🇸🇦 Saudi Arabia | Asia | 1% | 1% | 1% |
| 🇿🇦 South Africa | Africa | 1% | 0% | 1% |
| 🇨🇮 Côte d'Ivoire | Africa | 1% | 1% | 1% |
| 🇭🇰 Hong Kong | Asia | 1% | 0% | 0% |
| 🇦🇹 Austria | Europe | 1% | 0% | 0% |
| 🇬🇷 Greece | Europe | 1% | 1% | 0% |
| 🇹🇭 Thailand | Asia | 1% | 0% | 0% |
| 🇸🇬 Singapore | Asia | 1% | 0% | 0% |
| 🇲🇿 Mozambique | Africa | 1% | 1% | 0% |
| 🇹🇳 Tunisia | Africa | 1% | 0% | 0% |
| 🇮🇩 Indonesia | Asia | 1% | 1% | 0% |
| 🇳🇬 Nigeria | Africa | 0% | 0% | 1% |
| 🇦🇺 Australia | Oceania | 0% | 0% | 1% |
| 🇧🇼 Botswana | Africa | N/A | 1% | 1% |
| 🇳🇦 Namibia | Africa | N/A | 1% | 1% |
| 🇸🇿 Eswatini | Africa | N/A | 1% | 0% |
| 🇿🇲 Zambia | Africa | N/A | 1% | 0% |
Western European countries—Italy, France, Spain, Germany, Belgium and the UK—also accounted for a significant share of Africa’s exports throughout this time period. Part of this was due to century-old relationships and colonial legacies, but trade was also encouraged by initiatives like the 1976 Lomé Convention, which gave products from developing African countries (particularly former colonies) duty-free access to European markets in exchange for developmental aid.
During the mid-2000s, China also started to take up a growing share of the continent’s exports, as its rapid industrialization led to skyrocketing demand for commodities such as oil, iron ore, and copper—all key African exports.
Asia’s Growing Export Share Between 2010 and 2020
By the year 2010, as African exports topped the $481 billion per year mark, the global market was rapidly starting to change.
For starters, thanks to a considerable increase in domestic oil and natural gas production, the United States began cutting back on African petroleum imports.
At the same time, China had been actively seeking resources and investment opportunities in the developing world as part of its greater geopolitical strategy. By 2015, it had surpassed the U.S. as Africa’s primary export destination, marking a shift in the continent’s trade dynamics.
Here’s a look at all the countries with a 1% or greater share of Africa’s total export value from 2010 to 2020.
| Country | Region | 2010 | 2015 | 2020 |
|---|---|---|---|---|
| 🇺🇸 U.S. | North America | 15% | 5% | 5% |
| 🇨🇳 China | Asia | 11% | 12% | 15% |
| 🇮🇹 Italy | Europe | 8% | 5% | 4% |
| 🇪🇸 Spain | Europe | 6% | 6% | 6% |
| 🇫🇷 France | Europe | 6% | 6% | 5% |
| 🇮🇳 India | Asia | 5% | 7% | 6% |
| 🇩🇪 Germany | Europe | 4% | 4% | 5% |
| 🇬🇧 UK | Europe | 4% | 4% | 3% |
| 🇳🇱 Netherlands | Europe | 3% | 3% | 3% |
| 🇯🇵 Japan | Asia | 2% | 2% | 2% |
| 🇧🇪 Belgium | Europe | 2% | 2% | 2% |
| 🇿🇦 South Africa | Africa | 2% | 2% | 2% |
| 🇧🇷 Brazil | South America | 2% | 2% | 1% |
| 🇨🇦 Canada | North America | 2% | 1% | 1% |
| 🇦🇪 UAE | Asia | 1% | 3% | 6% |
| 🇨🇭 Switzerland | Europe | 1% | 2% | 3% |
| 🇹🇷 Turkiye | Asia | 1% | 1% | 2% |
| 🇵🇹 Portugal | Europe | 1% | 1% | 1% |
| 🇰🇷 South Korea | Asia | 1% | 1% | 1% |
| 🇧🇼 Botswana | Africa | 1% | 1% | 1% |
| 🇳🇦 Namibia | Africa | 1% | 1% | 1% |
| 🇿🇲 Zambia | Africa | 1% | 1% | 1% |
| 🇸🇦 Saudi Arabia | Asia | 1% | 1% | 1% |
| 🇬🇷 Greece | Europe | 1% | 0% | 1% |
| 🇦🇺 Australia | Oceania | 1% | 0% | 1% |
| 🇿🇼 Zimbabwe | Africa | 1% | 1% | 1% |
| 🇲🇾 Malaysia | Asia | 1% | 1% | 1% |
| 🇨🇩 DRC | Africa | 1% | 1% | 1% |
| 🇹🇼 Taiwan | Asia | 1% | 1% | 0% |
| 🇳🇬 Nigeria | Africa | 1% | 1% | 0% |
| 🇨🇮 Côte d'Ivoire | Africa | 1% | 1% | 0% |
| 🇮🇩 Indonesia | Asia | 0% | 1% | 1% |
| 🇲🇿 Mozambique | Africa | 0% | 1% | 1% |
| 🇭🇰 Hong Kong | Asia | 0% | 1% | 1% |
| 🇸🇬 Singapore | Asia | 0% | 0% | 1% |
| 🇹🇭 Thailand | Asia | 0% | 0% | 1% |
| 🇻🇳 Vietnam | Asia | 0% | 0% | 1% |
| 🇷🇺 Russia | Europe | 0% | 0% | 1% |
| 🇵🇰 Pakistan | Asia | 0% | 0% | 1% |
| 🇵🇱 Poland | Europe | 0% | 0% | 1% |
| 🇺🇬 Uganda | Asia | 0% | 0% | 1% |
China was joined in the top three ranks by India and the UAE, who were also experiencing rapid industrialization and growing demand for African commodities. In 2020, nearly 40% of Africa’s exports found a market in Asia, led by China and India’s significant trade volumes.
In comparison, Western Europe had started relinquish both its share and value of African goods imported. Alongside growing demand from developing countries, there became greater diversification in African export markets, with countries from Asia (Malaysia, Pakistan), Eastern Europe (Poland, Russia), and within Africa (the Democratic Republic of the Congo, Uganda), accounting for growing shares of African exports.
The Future of the African Export Market
Though Africa’s largest export markets are outside the continent for now, there is vast untapped potential for inter-regional exports, which stood at only 15% of total export value in 2020.
There is movement to expand on this trade, with the African Continental Free Trade Area (AfCFTA) established in 2018 to reduce trade barriers between African countries. According to UN estimates, it has the potential to create a $3 trillion market within the continent alone.
With one of the fastest-growing regional populations, the African continent’s economic stakes have never been higher. So who will end up dominating Africa’s trade landscape in the decades to come?
 |
WINNER: The 2023 Creator Program Challenge
Winners of our Creator Program Challenges receive their own ambassador badge, prize money, and become a trusted creator on Visual Capitalist. For all results from the 2023 Creator Program Challenge, click here to check out the year’s shortlist winners. |
-
 Markets2 weeks ago
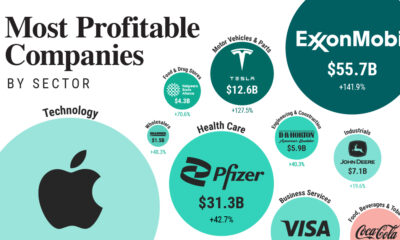
Ranked: The Most Profitable U.S. Companies, by Sector
-

 Technology5 days ago
How Long it Took for Popular Apps to Reach 100 Million Users
-
 Markets4 weeks ago
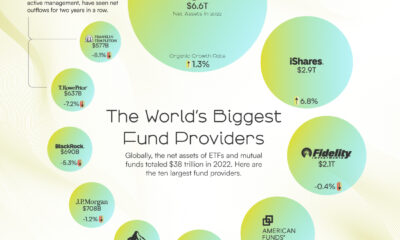
The World’s Biggest Mutual Fund and ETF Providers
-

 Brands2 weeks ago
Brand Reputations: Ranking the Best and Worst in 2023
-
 Environment5 days ago
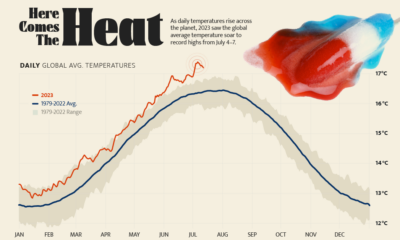
Hotter Than Ever: 2023 Sets New Global Temperature Records
-

 Datastream4 weeks ago
Can You Calculate Your Daily Carbon Footprint?
-
 Energy2 weeks ago
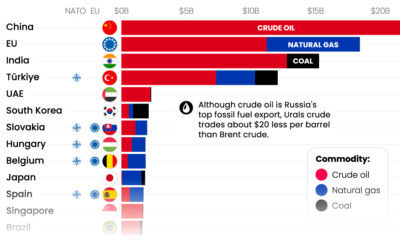
Who’s Still Buying Russian Fossil Fuels in 2023?
-

 VC+4 days ago
What’s New on VC+ in July