Mining
Visualizing U.S. Consumption of Fuel and Materials per Capita
![]() Subscribe to the Elements free mailing list for more like this
Subscribe to the Elements free mailing list for more like this
Visualizing U.S. Consumption of Fuel and Materials per Capita
This was originally posted on Elements. Sign up to the free mailing list to get beautiful visualizations on natural resource megatrends in your email every week.
Wealthy countries consume massive amounts of natural resources per capita, and the United States is no exception.
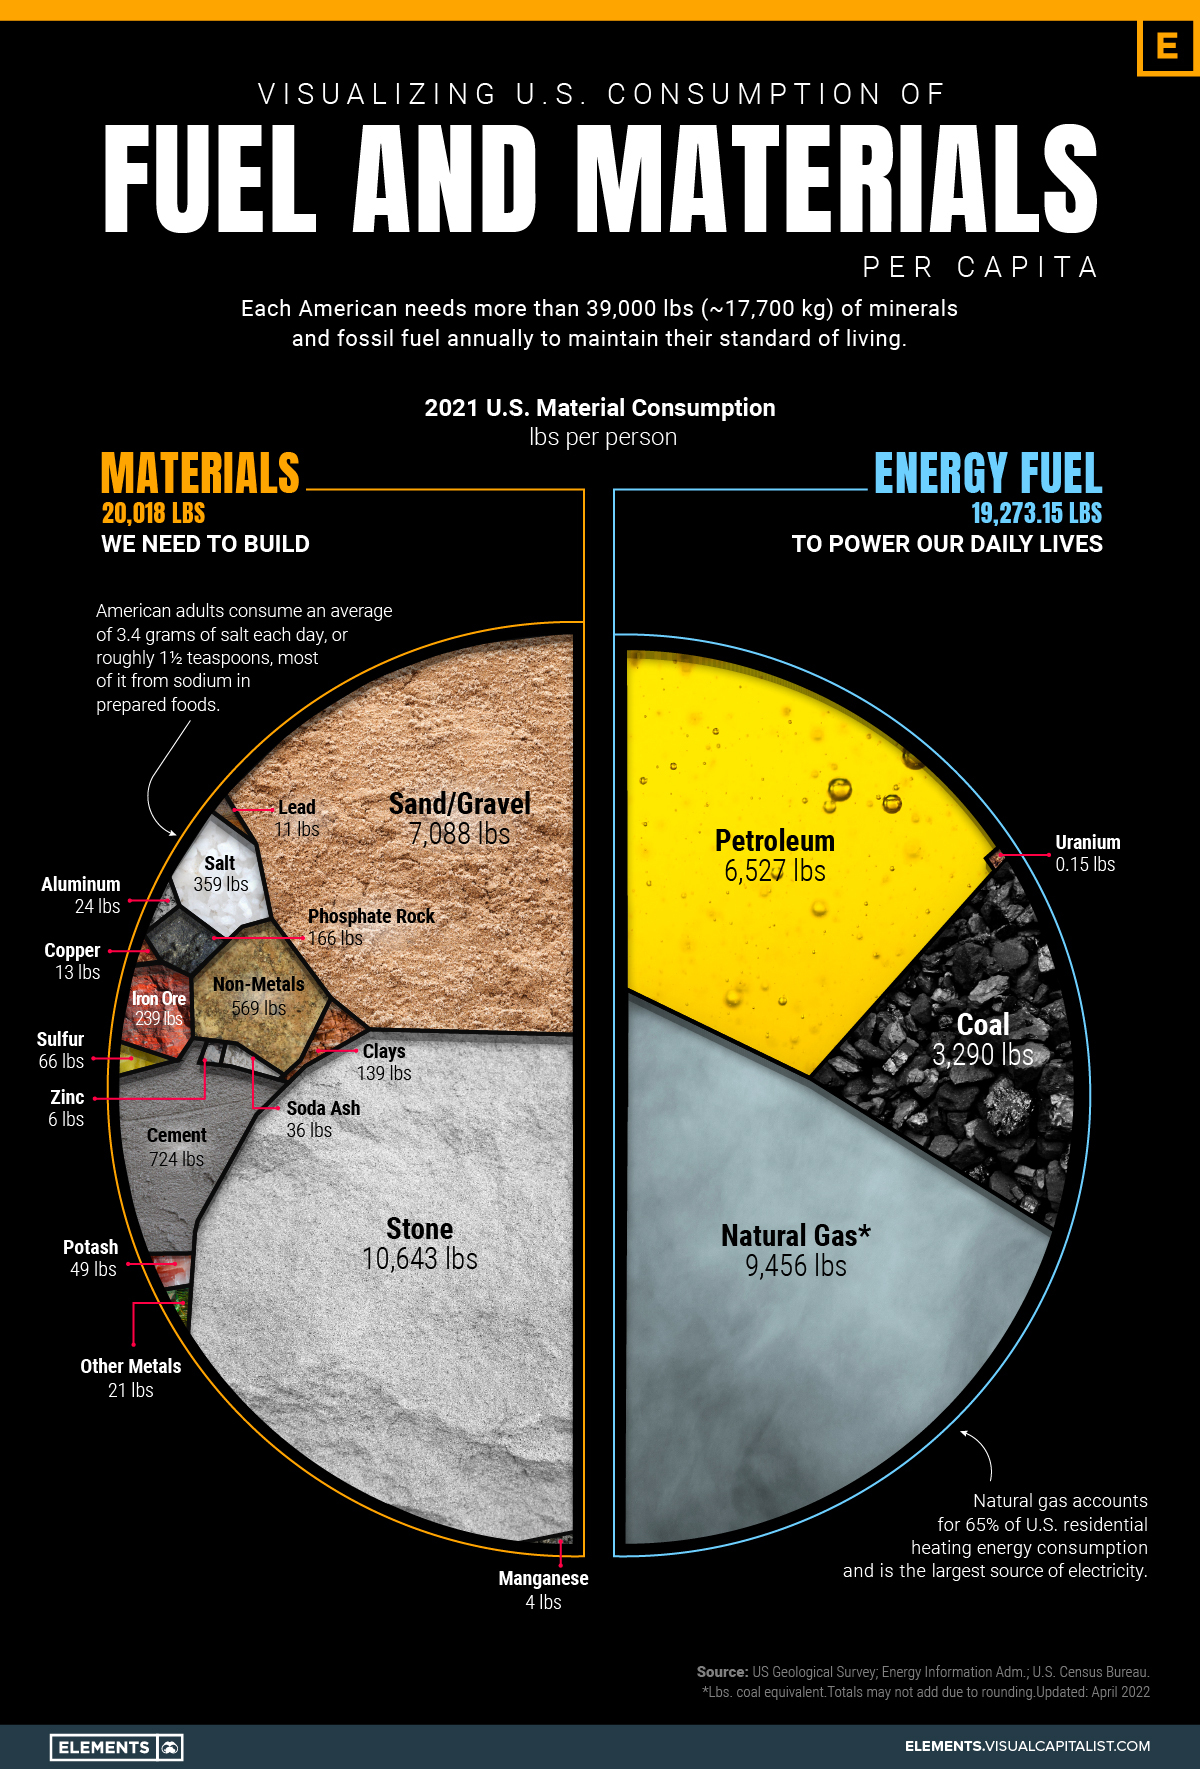
According to data from the National Mining Association, each American needs more than 39,000 pounds (17,700 kg) of minerals and fossil fuels annually to maintain their standard of living.
Materials We Need to Build
Every building around us and every sidewalk we walk on is made of sand, steel, and cement.
As a result, these materials lead consumption per capita in the United States. On average, each person in America drives the demand of over 10,000 lbs of stone and around 7,000 lbs of sand and gravel per year.
| Material/Fossil Fuel | Pounds Per Person |
|---|---|
| Stone | 10,643 |
| Natural Gas | 9,456 |
| Sand, Gravel | 7,088 |
| Petroleum Products | 6,527 |
| Coal | 3,290 |
| Cement | 724 |
| Other Nonmetals | 569 |
| Salt | 359 |
| Iron Ore | 239 |
| Phosphate Rock | 166 |
| Sulfur | 66 |
| Potash | 49 |
| Soda Ash | 36 |
| Bauxite (Aluminum) | 24 |
| Other Metals | 21 |
| Copper | 13 |
| Lead | 11 |
| Zinc | 6 |
| Manganese | 4 |
| Total | 39,291 |
The construction industry is a major contributor to the U.S. economy.
Crushed stone, sand, gravel, and other construction aggregates represent half of the industrial minerals produced in the country, resulting in $29 billion in revenue per year.
Also on the list are crucial hard metals such as copper, aluminum, iron ore, and of course many rarer metals used in smaller quantities each year. These rarer metals can make a big economic difference even when their uses are more concentrated and isolated—for example, palladium (primarily used in catalytic converters) costs $54 million per tonne.
Fuels Powering our Lives
Despite ongoing efforts to fight climate change and reduce carbon emissions, each person in the U.S. uses over 19,000 lbs of fossil fuels per year.

Gasoline is the most consumed petroleum product in the United States.
In 2021, finished motor gasoline consumption averaged about 369 million gallons per day, equal to about 44% of total U.S. petroleum use. Distillate fuel oil (20%), hydrocarbon gas liquids (17%), and jet fuel (7%) were the next most important uses.
Reliance on Other Countries
Over the past three decades, the United States has become reliant on foreign sources to meet domestic demand for minerals and fossil fuels. Today, the country is 100% import-reliant for 17 mineral commodities and at least 50% for 30 others.
In order to reduce the dependency on other countries, namely China, the Biden administration has been working to diversify supply chains in critical minerals. This includes strengthening alliances with other countries such as Australia, India, and Japan.
However, questions still remain about how soon these policies can make an impact, and the degree to which they can ultimately help localize and diversify supply chains.


Energy
How Big is the Market for Crude Oil?
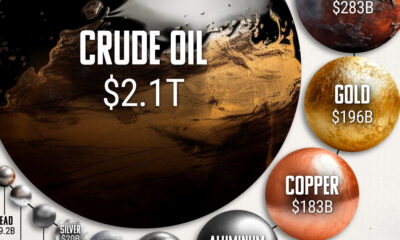
The oil market is bigger than the 10 largest metal markets combined, with production value exceeding $2 trillion annually.

How Big is the Market for Crude Oil?
This was originally posted on Elements. Sign up to the free mailing list to get beautiful visualizations on real assets and resource megatrends each week.
While the global economy relies on many commodities, none come close to the massive scale of the crude oil market.
Besides being the primary energy source for transportation, oil is a key raw material for numerous other industries like plastics, fertilizers, cosmetics, and medicine. As a result, the global physical oil market is astronomical in size and has a significant economic and geopolitical influence, with a few countries dominating global oil production.
The above infographic puts crude oil’s market size into perspective by comparing it to the 10 largest metal markets combined. To calculate market sizes, we used the latest price multiplied by global production in 2022, based on data from TradingEconomics and the United States Geological Survey (USGS).
Note: This analysis focuses on raw and physical materials, excluding derivative markets and alloy materials like steel.
How Big Is the Oil Market?
In 2022, the world produced an average of 80.75 million barrels of oil per day (including condensates). That puts annual crude oil production at around 29.5 billion barrels, with the market size exceeding $2 trillion at current prices.
That figure dwarfs the combined size of the 10 largest metal markets:
| Commodity | 2022 Annual Production | Market Size |
|---|---|---|
| Crude Oil | 29.5 billion barrels | $2.1 trillion |
| Iron Ore | 2.6 billion tonnes | $283.4 billion |
| Gold | 3,100 tonnes | $195.9 billion |
| Copper | 22 million tonnes | $183.3 billion |
| Aluminum | 69 million tonnes | $152.6 billion |
| Nickel | 3.3 million tonnes | $68.8 billion |
| Zinc | 13 million tonnes | $30.9 billion |
| Silver | 26,000 tonnes | $19.9 billion |
| Molybdenum | 250,000 tonnes | $12.9 billion |
| Palladium | 210 tonnes | $9.5 billion |
| Lead | 4.5 million tonnes | $9.2 billion |
Based on prices as of June 7, 2023.
The combined market size of the top 10 metal markets amounts to $967 billion, less than half that of the oil market. In fact, even if we added all the remaining smaller raw metal markets, the oil market would still be far bigger.
This also reflects the massive scale of global oil consumption annually, with the resource having a ubiquitous presence in our daily lives.
The Big Picture
While the oil market towers over metal markets, it’s important to recognize that this doesn’t downplay the importance of these commodities.
Metals form a critical building block of the global economy, playing a key role in infrastructure, energy technologies, and more. Meanwhile, precious metals like gold and silver serve as important stores of value.
As the world shifts towards a more sustainable future and away from fossil fuels, it’ll be interesting to see how the markets for oil and other commodities evolve.

-

 apps5 days ago
How Long it Took for Popular Apps to Reach 100 Million Users
-

 Datastream4 weeks ago
Can You Calculate Your Daily Carbon Footprint?
-

 Brands2 weeks ago
Brand Reputations: Ranking the Best and Worst in 2023
-
 Environment5 days ago
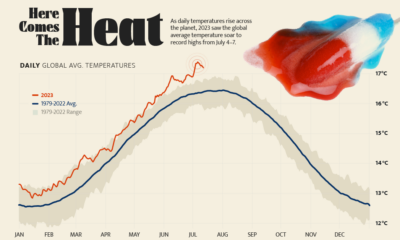
Hotter Than Ever: 2023 Sets New Global Temperature Records
-

 Investor Education4 weeks ago
Visualizing BlackRock’s Top Equity Holdings
-
 Energy2 weeks ago
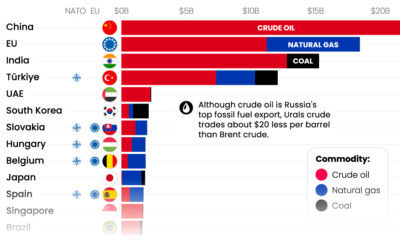
Who’s Still Buying Russian Fossil Fuels in 2023?
-

 VC+4 days ago
What’s New on VC+ in July
-

 UK Only4 weeks ago
Charting the Rise of Cross-Border Money Transfers (2015-2023)