Energy
Visualizing the World’s Largest Lithium Producers
![]() Subscribe to the Elements free mailing list for more like this
Subscribe to the Elements free mailing list for more like this


Visualizing the World’s Largest Lithium Producers in 2022
This was originally posted on Elements. Sign up to the free mailing list to get beautiful visualizations on real assets and resource megatrends each week.
Lithium has become essential in recent years, primarily due to the boom in electric vehicles and other clean technologies that rely on lithium batteries.
The global lithium-ion battery market was valued at $52 billion in 2022 and is expected to reach $194 billion in 2030.
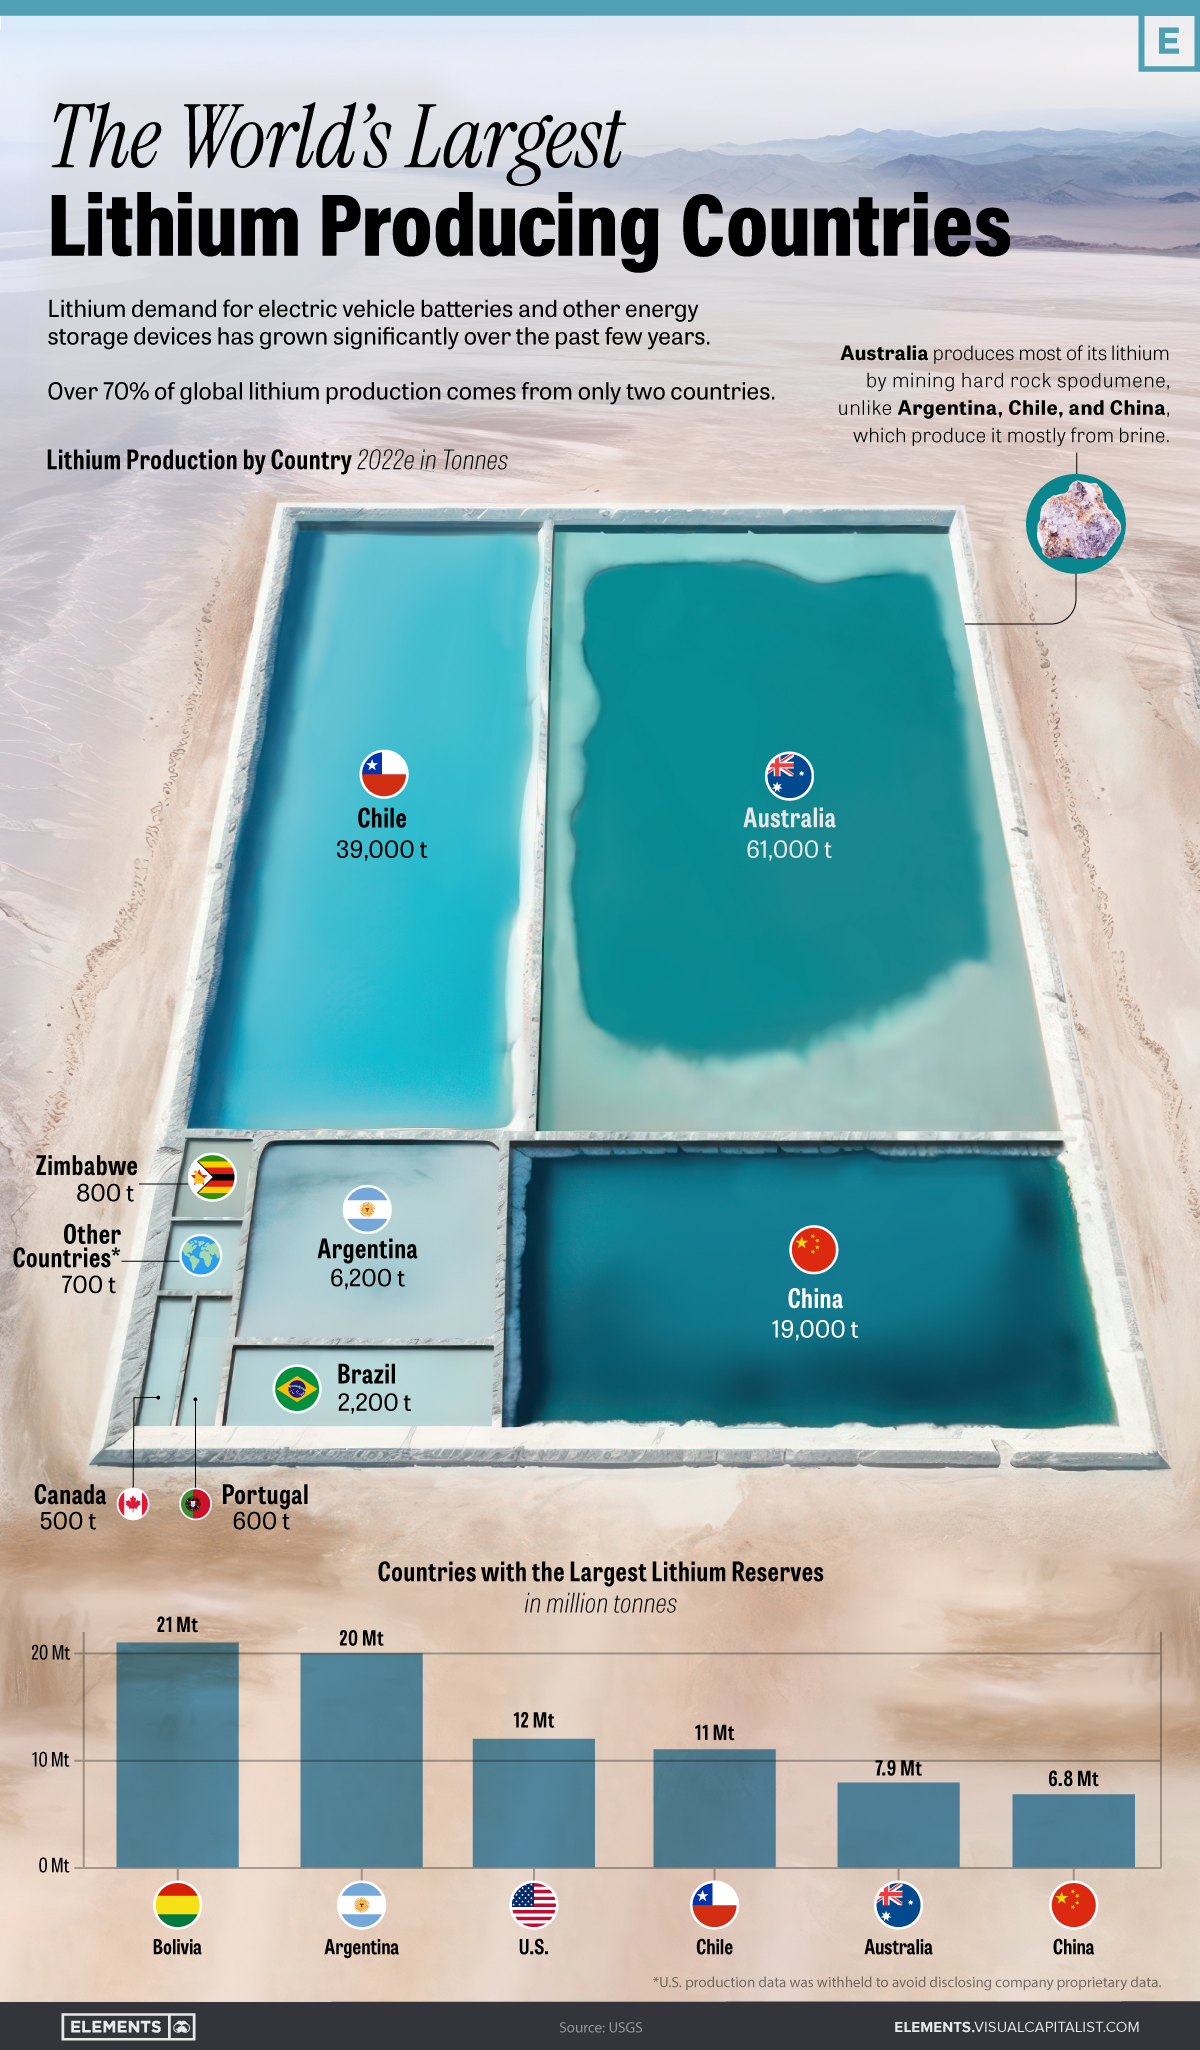
The infographic above uses data from the United States Geological Survey to explore the world’s largest lithium producing countries.
Australia and Chile: Dominating Global Lithium Supply
Australia and Chile stand out as the top producers of lithium, accounting for almost 77% of the global production in 2022.
| Rank | Country | Mine production 2022E (tonnes) | Share (%) |
|---|---|---|---|
| 1 | 🇦🇺 Australia | 61,000 | 46.9% |
| 2 | 🇨🇱 Chile | 39,000 | 30.0% |
| 3 | 🇨🇳 China | 19,000 | 14.6% |
| 4 | 🇦🇷 Argentina | 6,200 | 4.8% |
| 5 | 🇧🇷 Brazil | 2,200 | 1.7% |
| 6 | 🇿🇼 Zimbabwe | 800 | 0.6% |
| 7 | 🇵🇹 Portugal | 600 | 0.5% |
| 8 | 🇨🇦 Canada | 500 | 0.4% |
| 🌎 Other countries* | 700 | 0.5% | |
| 🌐 World Total | 130,000 | 100.0% |
*U.S. production data was withheld to avoid disclosing proprietary company data
Australia, the world’s leading producer, extracts lithium directly from hard rock mines, specifically the mineral spodumene.
Chile, along with Argentina, China, and other top producers, extracts lithium from brine.
Hard rock provides greater flexibility as lithium hosted in spodumene can be processed into either lithium hydroxide or lithium carbonate. It also offers faster processing and higher quality as spodumene typically contains higher lithium content.
Extracting lithium from brine, on the other hand, offers the advantage of lower production costs and a smaller impact on the environment. The following visual from Benchmark Minerals helps break down the carbon impact of different types of lithium extraction.
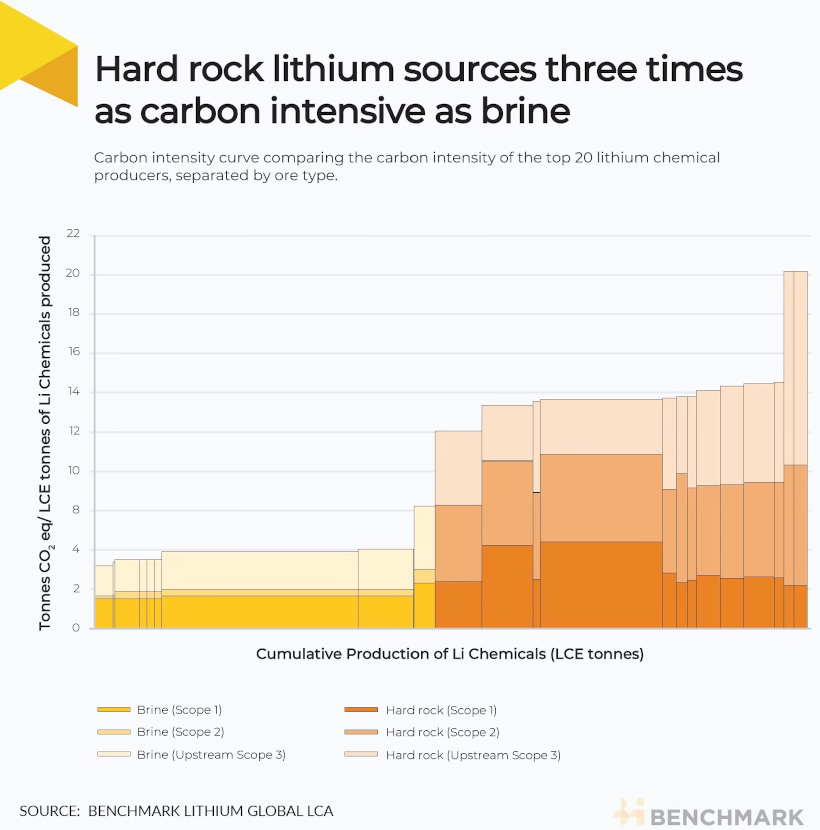
With that said, brine extraction can also face challenges related to water availability and environmental impacts on local ecosystems.
Historical Shifts in the Lithium Supply Chain
In the 1990s, the United States held the title of the largest lithium producer, producing over one-third of the global production in 1995.
However, Chile eventually overtook the U.S., experiencing a production boom in the Salar de Atacama, one of the world’s richest lithium brine deposits. Since then, Australia’s lithium production has also skyrocketed, now accounting for 47% of the world’s lithium production.
China, the world’s third-largest producer, not only focuses on developing domestic mines but has also strategically acquired approximately $5.6 billion worth of lithium assets in countries like Chile, Canada, and Australia over the past decade.
Furthermore, China currently hosts nearly 60% of the world’s lithium refining capacity for batteries, underlining its dominant position in the lithium supply chain.
Meeting Lithium Demand: The Need for New Production
As the world increases its production of batteries and electric vehicles, the demand for lithium is projected to soar.
In 2021, global lithium carbonate equivalent (LCE) production sat at 540,000 tonnes.
By 2025, demand is expected to reach 1.5 million tonnes of LCE. By 2030, this number is estimated to exceed 3 million tonnes.


Batteries
Visualized: The Rise of the LFP Battery
In 2022, the EV sector’s market share of the LFP battery rose from just 6% in 2020 to 30%, highlighting its growing popularity.


The Rise of the LFP Battery
Primarily a key component in fertilizers, phosphate is also essential to lithium iron phosphate (LFP) battery technology.
LFP is an emerging favorite in the expanding EV market, particularly in standard-range EVs. Factors driving this popularity include superior safety, longevity, cost-effectiveness, and environmental sustainability.
In this graphic, our sponsor First Phosphate looks at the growing LFP market, highlighting forecasted growth and current market share.
Market Growth
In 2022, the global LFP battery market stood at $12.5 billion. By 2030, this figure is expected to catapult to nearly $52.7 billion, signifying a CAGR of 19.7%.
| Year | USD (Billion) |
|---|---|
| 2021 | $10.5B |
| 2022 | $12.5B |
| 2023F | $15.0B |
| 2024F | $17.9B |
| 2025F | $21.5B |
| 2026F | $25.7B |
| 2027F | $30.7B |
| 2028F | $36.8B |
| 2029F | $44.0B |
| 2030F | $52.7B |
In 2022, LFP batteries cornered a sizable 30% of the EV market share from just 6% in 2020, demonstrating the growing appeal of this type of lithium-ion battery in the electric vehicle sector.
Market Share
The Asia Pacific region dominated the LFP battery market in 2021, accounting for over 34% of the global share.
| Regions | Revenue Share (%) |
|---|---|
| Asia Pacific | 34% |
| North America | 29% |
| Europe | 23% |
| Latin America | 10% |
| MEA | 4% |
Meanwhile, North America, with the second largest share, is projected to witness ongoing growth through 2030.
First Phosphate holds access to 1% of the world’s purest igneous rock phosphate reserves in Québec, making it an ideal supplier for the growing LFP market.

-

 Maps2 months ago
Mapped: Renewable Energy and Battery Installations in the U.S. in 2023
This graphic describes new U.S. renewable energy installations by state along with nameplate capacity, planned to come online in 2023.
-
 Energy2 months ago
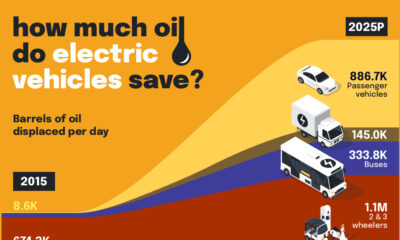
How EV Adoption Will Impact Oil Consumption (2015-2025P)
How much oil is saved by adding electric vehicles into the mix? We look at data from 2015 to 2025P for different types of EVs.
-

 Energy3 months ago
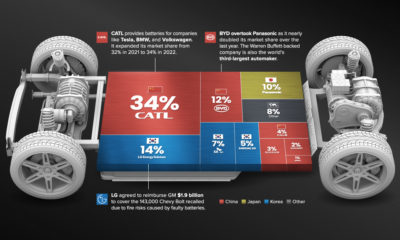
Global EV Production: BYD Surpasses Tesla
This graphic explores the latest EV production data for 2022, which shows BYD taking a massive step forward to surpass Tesla.
-
 Batteries6 months ago
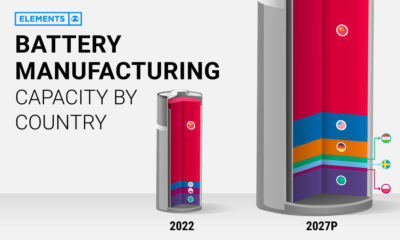
Visualizing China’s Dominance in Battery Manufacturing (2022-2027P)
This infographic breaks down battery manufacturing capacity by country in 2022 and 2027.
-

 Energy7 months ago
Visualizing 25 Years of Lithium Production, by Country
Lithium production has grown exponentially over the last few decades. Which countries produce the most lithium, and how how has this mix evolved?
-
 Energy10 months ago
The Top 10 EV Battery Manufacturers in 2022
Despite efforts from the U.S. and Europe to increase the domestic production of batteries, the market is still dominated by Asian suppliers.

-
 Environment5 days ago
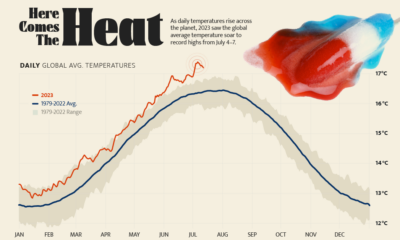
Hotter Than Ever: 2023 Sets New Global Temperature Records
-

 Datastream4 weeks ago
Can You Calculate Your Daily Carbon Footprint?
-
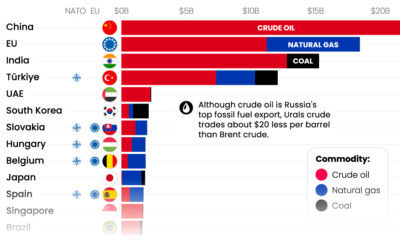
 Energy2 weeks ago
Who’s Still Buying Russian Fossil Fuels in 2023?
-

 VC+4 days ago
What’s New on VC+ in July
-

 Markets4 weeks ago
Visualizing BlackRock’s Top Equity Holdings
-

 Technology2 weeks ago
Meet the Competing Apps Battling for Twitter’s Market Share
-
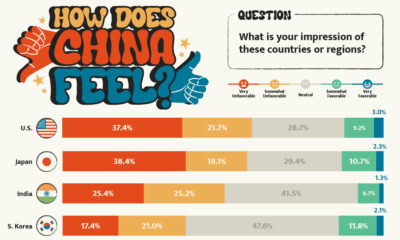
 China13 hours ago
How Do Chinese Citizens Feel About Other Countries?
-

 Markets4 weeks ago
Visualizing Every Company on the S&P 500 Index