Energy
Life Cycle Emissions: EVs vs. Combustion Engine Vehicles
![]() Subscribe to the Elements free mailing list for more like this
Subscribe to the Elements free mailing list for more like this
Life Cycle Emissions: EVs vs. Combustion Engine Vehicles
This was originally posted on Elements. Sign up to the free mailing list to get beautiful visualizations on real assets and resource megatrends each week.
According to the International Energy Agency, the transportation sector is more reliant on fossil fuels than any other sector in the economy. In 2021, it accounted for 37% of all CO2 emissions from end‐use sectors.
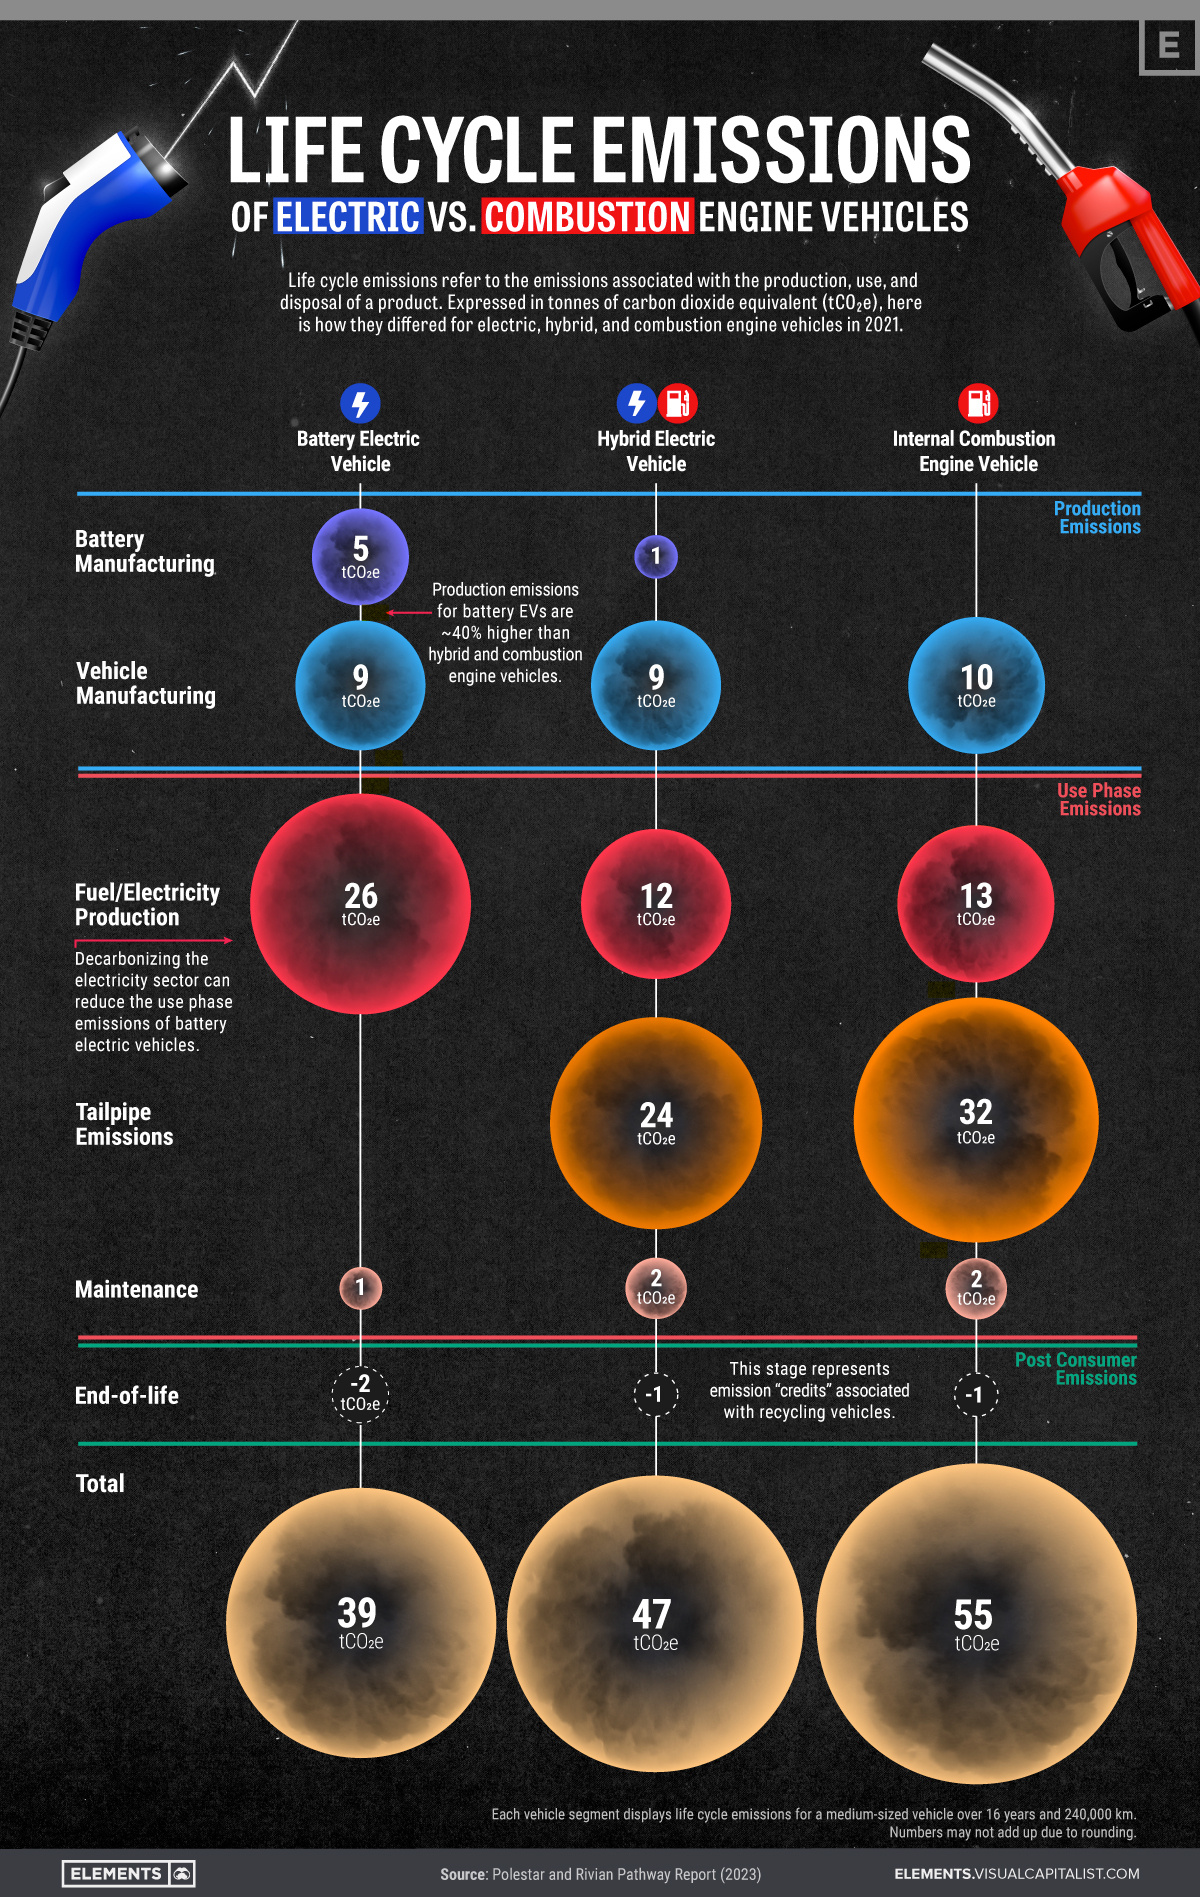
To gain insights into how different vehicle types contribute to these emissions, the above graphic visualizes the life cycle emissions of battery electric, hybrid, and internal combustion engine (ICE) vehicles using Polestar and Rivian’s Pathway Report.
Production to Disposal: Emissions at Each Stage
Life cycle emissions are the total amount of greenhouse gases emitted throughout a product’s existence, including its production, use, and disposal.
To compare these emissions effectively, a standardized unit called metric tons of CO2 equivalent (tCO2e) is used, which accounts for different types of greenhouse gases and their global warming potential.
Here is an overview of the 2021 life cycle emissions of medium-sized electric, hybrid and ICE vehicles in each stage of their life cycles, using tCO2e. These numbers consider a use phase of 16 years and a distance of 240,000 km.
| Battery electric vehicle | Hybrid electric vehicle | Internal combustion engine vehicle | ||
|---|---|---|---|---|
| Production emissions (tCO2e) | Battery manufacturing | 5 | 1 | 0 |
| Vehicle manufacturing | 9 | 9 | 10 | |
| Use phase emissions (tCO2e) | Fuel/electricity production | 26 | 12 | 13 |
| Tailpipe emissions | 0 | 24 | 32 | |
| Maintenance | 1 | 2 | 2 | |
| Post consumer emissions (tCO2e) | End-of-life | -2 | -1 | -1 |
| TOTAL | 39 tCO2e | 47 tCO2e | 55 tCO2e |
While it may not be surprising that battery electric vehicles (BEVs) have the lowest life cycle emissions of the three vehicle segments, we can also take some other insights from the data that may not be as obvious at first.
- The production emissions for BEVs are approximately 40% higher than those of hybrid and ICE vehicles. According to a McKinsey & Company study, this high emission intensity can be attributed to the extraction and refining of raw materials like lithium, cobalt, and nickel that are needed for batteries, as well as the energy-intensive manufacturing process of BEVs.
- Electricity production is by far the most emission-intensive stage in a BEVs life cycle. Decarbonizing the electricity sector by implementing renewable and nuclear energy sources can significantly reduce these vehicles’ use phase emissions.
- By recycling materials and components in their end-of-life stages, all vehicle segments can offset a portion of their earlier life cycle emissions.
Accelerating the Transition to Electric Mobility
As we move toward a carbon-neutral economy, battery electric vehicles can play an important role in reducing global CO2 emissions.
Despite their lack of tailpipe emissions, however, it’s good to note that many stages of a BEV’s life cycle are still quite emission-intensive, specifically when it comes to manufacturing and electricity production.
Advancing the sustainability of battery production and fostering the adoption of clean energy sources can, therefore, aid in lowering the emissions of BEVs even further, leading to increased environmental stewardship in the transportation sector.


Batteries
Visualized: The Rise of the LFP Battery
In 2022, the EV sector’s market share of the LFP battery rose from just 6% in 2020 to 30%, highlighting its growing popularity.


The Rise of the LFP Battery
Primarily a key component in fertilizers, phosphate is also essential to lithium iron phosphate (LFP) battery technology.
LFP is an emerging favorite in the expanding EV market, particularly in standard-range EVs. Factors driving this popularity include superior safety, longevity, cost-effectiveness, and environmental sustainability.
In this graphic, our sponsor First Phosphate looks at the growing LFP market, highlighting forecasted growth and current market share.
Market Growth
In 2022, the global LFP battery market stood at $12.5 billion. By 2030, this figure is expected to catapult to nearly $52.7 billion, signifying a CAGR of 19.7%.
| Year | USD (Billion) |
|---|---|
| 2021 | $10.5B |
| 2022 | $12.5B |
| 2023F | $15.0B |
| 2024F | $17.9B |
| 2025F | $21.5B |
| 2026F | $25.7B |
| 2027F | $30.7B |
| 2028F | $36.8B |
| 2029F | $44.0B |
| 2030F | $52.7B |
In 2022, LFP batteries cornered a sizable 30% of the EV market share from just 6% in 2020, demonstrating the growing appeal of this type of lithium-ion battery in the electric vehicle sector.
Market Share
The Asia Pacific region dominated the LFP battery market in 2021, accounting for over 34% of the global share.
| Regions | Revenue Share (%) |
|---|---|
| Asia Pacific | 34% |
| North America | 29% |
| Europe | 23% |
| Latin America | 10% |
| MEA | 4% |
Meanwhile, North America, with the second largest share, is projected to witness ongoing growth through 2030.
First Phosphate holds access to 1% of the world’s purest igneous rock phosphate reserves in Québec, making it an ideal supplier for the growing LFP market.

-

 Batteries2 months ago
Mapped: Renewable Energy and Battery Installations in the U.S. in 2023
This graphic describes new U.S. renewable energy installations by state along with nameplate capacity, planned to come online in 2023.
-
 Batteries2 months ago
How EV Adoption Will Impact Oil Consumption (2015-2025P)
How much oil is saved by adding electric vehicles into the mix? We look at data from 2015 to 2025P for different types of EVs.
-

 Batteries3 months ago
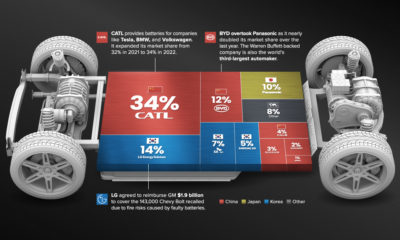
Global EV Production: BYD Surpasses Tesla
This graphic explores the latest EV production data for 2022, which shows BYD taking a massive step forward to surpass Tesla.
-
 Batteries6 months ago
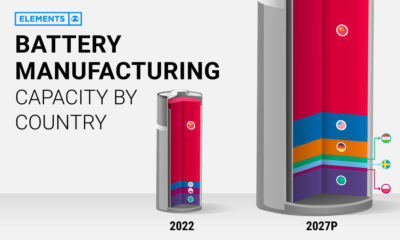
Visualizing China’s Dominance in Battery Manufacturing (2022-2027P)
This infographic breaks down battery manufacturing capacity by country in 2022 and 2027.
-

 Mining7 months ago
Visualizing 25 Years of Lithium Production, by Country
Lithium production has grown exponentially over the last few decades. Which countries produce the most lithium, and how how has this mix evolved?
-
 Energy10 months ago
The Top 10 EV Battery Manufacturers in 2022
Despite efforts from the U.S. and Europe to increase the domestic production of batteries, the market is still dominated by Asian suppliers.

-

 VC+4 days ago
What’s New on VC+ in July
-

 Datastream4 weeks ago
Can You Calculate Your Daily Carbon Footprint?
-

 apps2 weeks ago
Meet the Competing Apps Battling for Twitter’s Market Share
-
 Politics17 hours ago
How Do Chinese Citizens Feel About Other Countries?
-

 Investor Education4 weeks ago
Visualizing BlackRock’s Top Equity Holdings
-

 Markets2 weeks ago
Visualizing 1 Billion Square Feet of Empty Office Space
-

 Markets4 weeks ago
Visualizing Every Company on the S&P 500 Index
-

 Maps2 weeks ago
Vintage Viz: The World’s Rivers and Lakes, Organized Neatly