Healthcare
Visualizing the Composition of Blood


The Composition of Blood
Have you ever wondered what blood is made up of?
With the average adult possessing five to six liters of blood in the body, this fluid is vital to our lives, circulating oxygen through the body and serving many different functions.
Despite its simple, deep-red appearance, blood is comprised of many tiny chemical components. This infographic visualizes the composition of blood and the microscopic contents in it.
What is Blood Made Up Of?
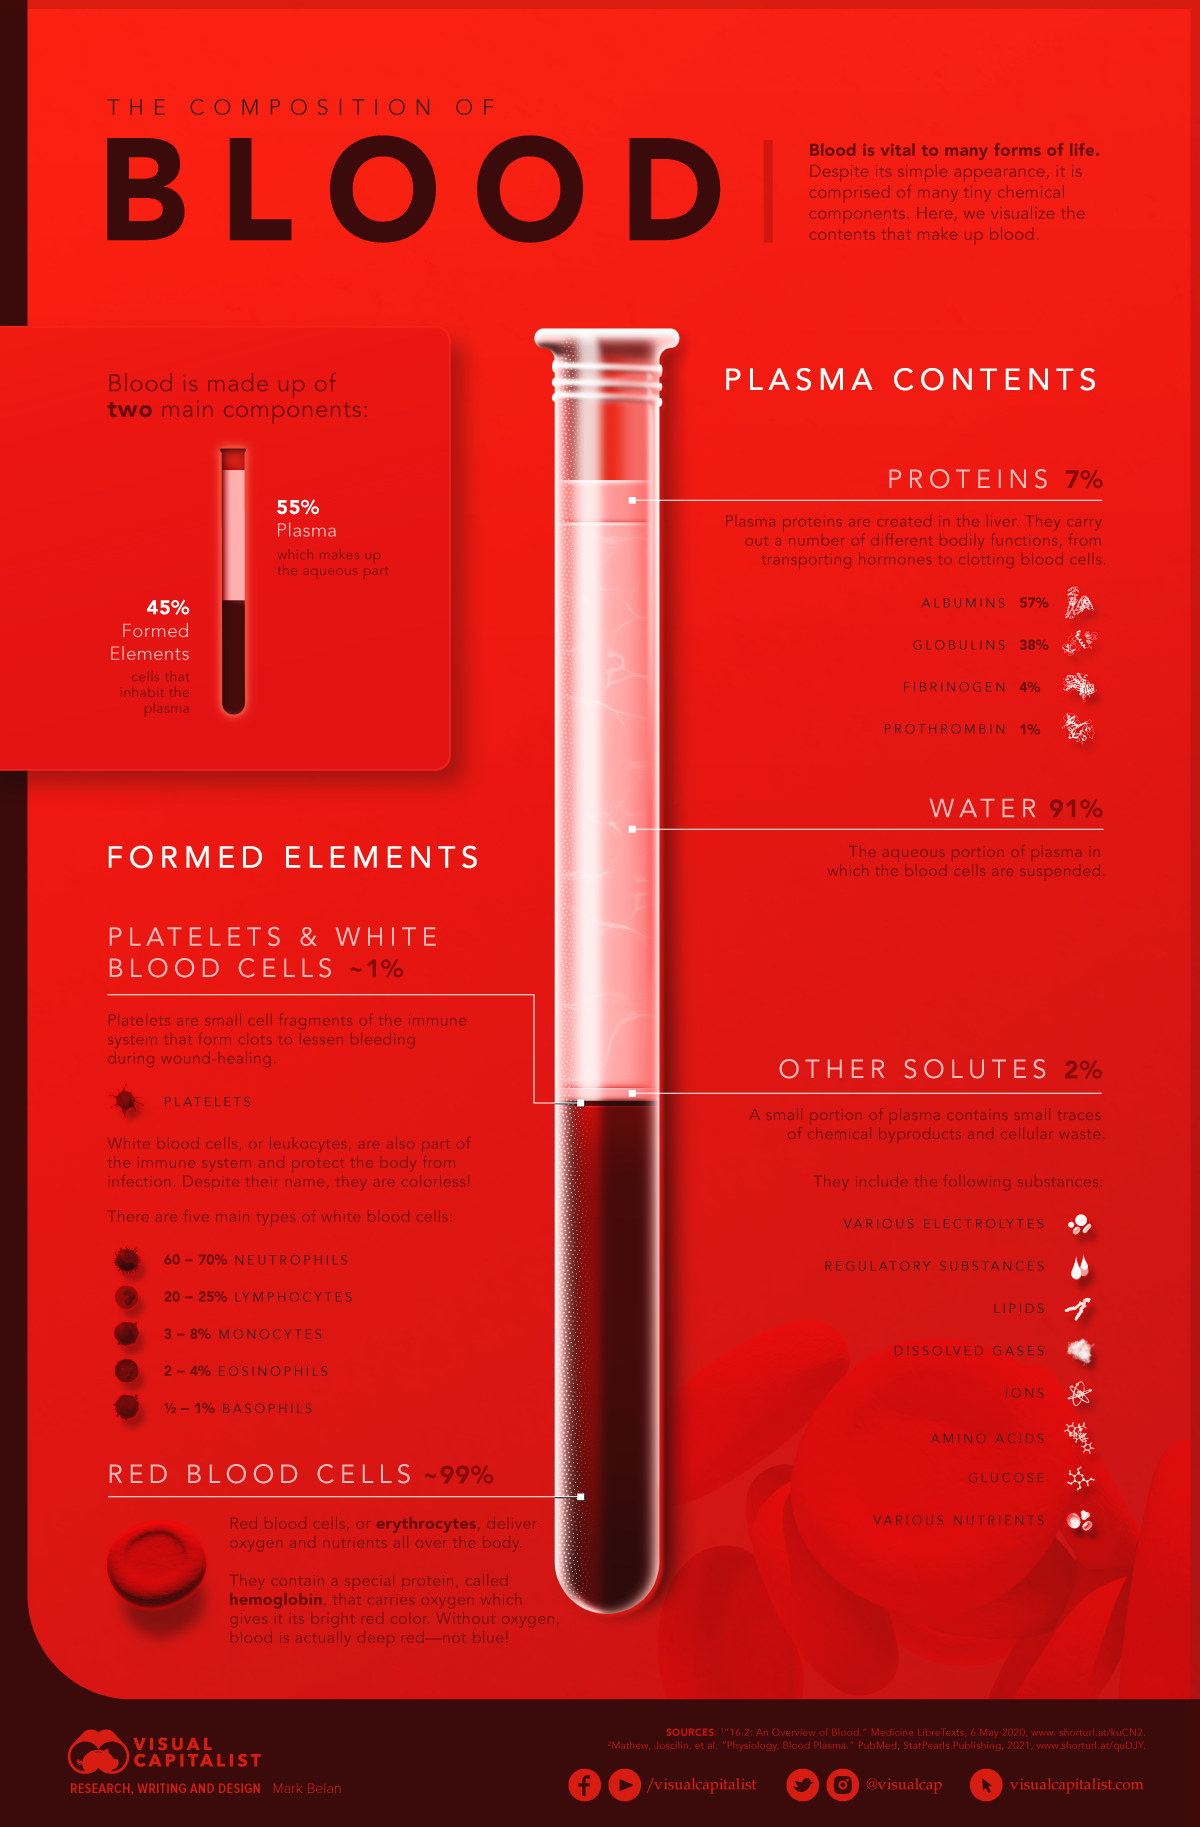
There are two main components that comprise blood:
- Plasma – 55%
Plasma is the fluid or aqueous part of blood, making up more than half of blood content. - Formed elements – 45%
Formed elements refer to the cells, platelets, and cell fragments that are suspended in the plasma.
Plasma
Plasma is primarily made up of water (91%), salts, and enzymes, but it also carries important proteins and components that serve many bodily functions.
Plasma proteins make up 7% of plasma contents and are created in the liver. These include:
- Albumins
These proteins keep fluids from leaking out of blood vessels into other parts of the body. They also transport important molecules like calcium and help neutralize toxins. - Globulins
These play an important role in clotting blood and fighting infections and are also transporters of hormones, minerals, and fats. - Fibrinogen and Prothrombin
Both of these proteins help stop bleeding by facilitating the creation of blood clots during wound-healing.
Water and proteins make up 98% of plasma in blood. The other 2% is made up of small traces of chemical byproducts and cellular waste, including electrolytes, glucose, and other nutrients.
Formed Elements
There are three categories of formed elements in blood: platelets, white blood cells, and red blood cells. Red blood cells make up 99% of formed elements, with the other 1% comprised of platelets and white blood cells.
- Platelets (Thrombocytes)
Platelets are cells from the immune system with the primary function of forming clots to reduce bleeding from wounds. This makes them critical not only for small wounds like cuts but also for surgeries and traumatic injuries. - White blood cells (Leukocytes)
White blood cells protect our bodies from infection. There are five types of white blood cells with different roles in fighting infections: some attack foreign cells and viruses, some produce antibodies, some clean up dead cells, and some respond to allergens. - Red blood cells (Erythrocytes)
Red blood cells deliver fresh oxygen and nutrients all over the body. They contain a special protein called hemoglobin, which carries oxygen and gives blood its bright red color.
The lifespan of a typical red blood cell is around 120 days, after which it dies and is replaced by a new cell. Our bodies are constantly producing red blood cells in the bone marrow, at a rate of millions of cells per second.
Abnormal Red Blood Cells
Normal red blood cells are round, flattened disks that are thinner in the middle. However, certain diseases and medical therapies can change the shape of red blood cells in different ways.
Here are the types of abnormal red blood cells and their associated diseases:
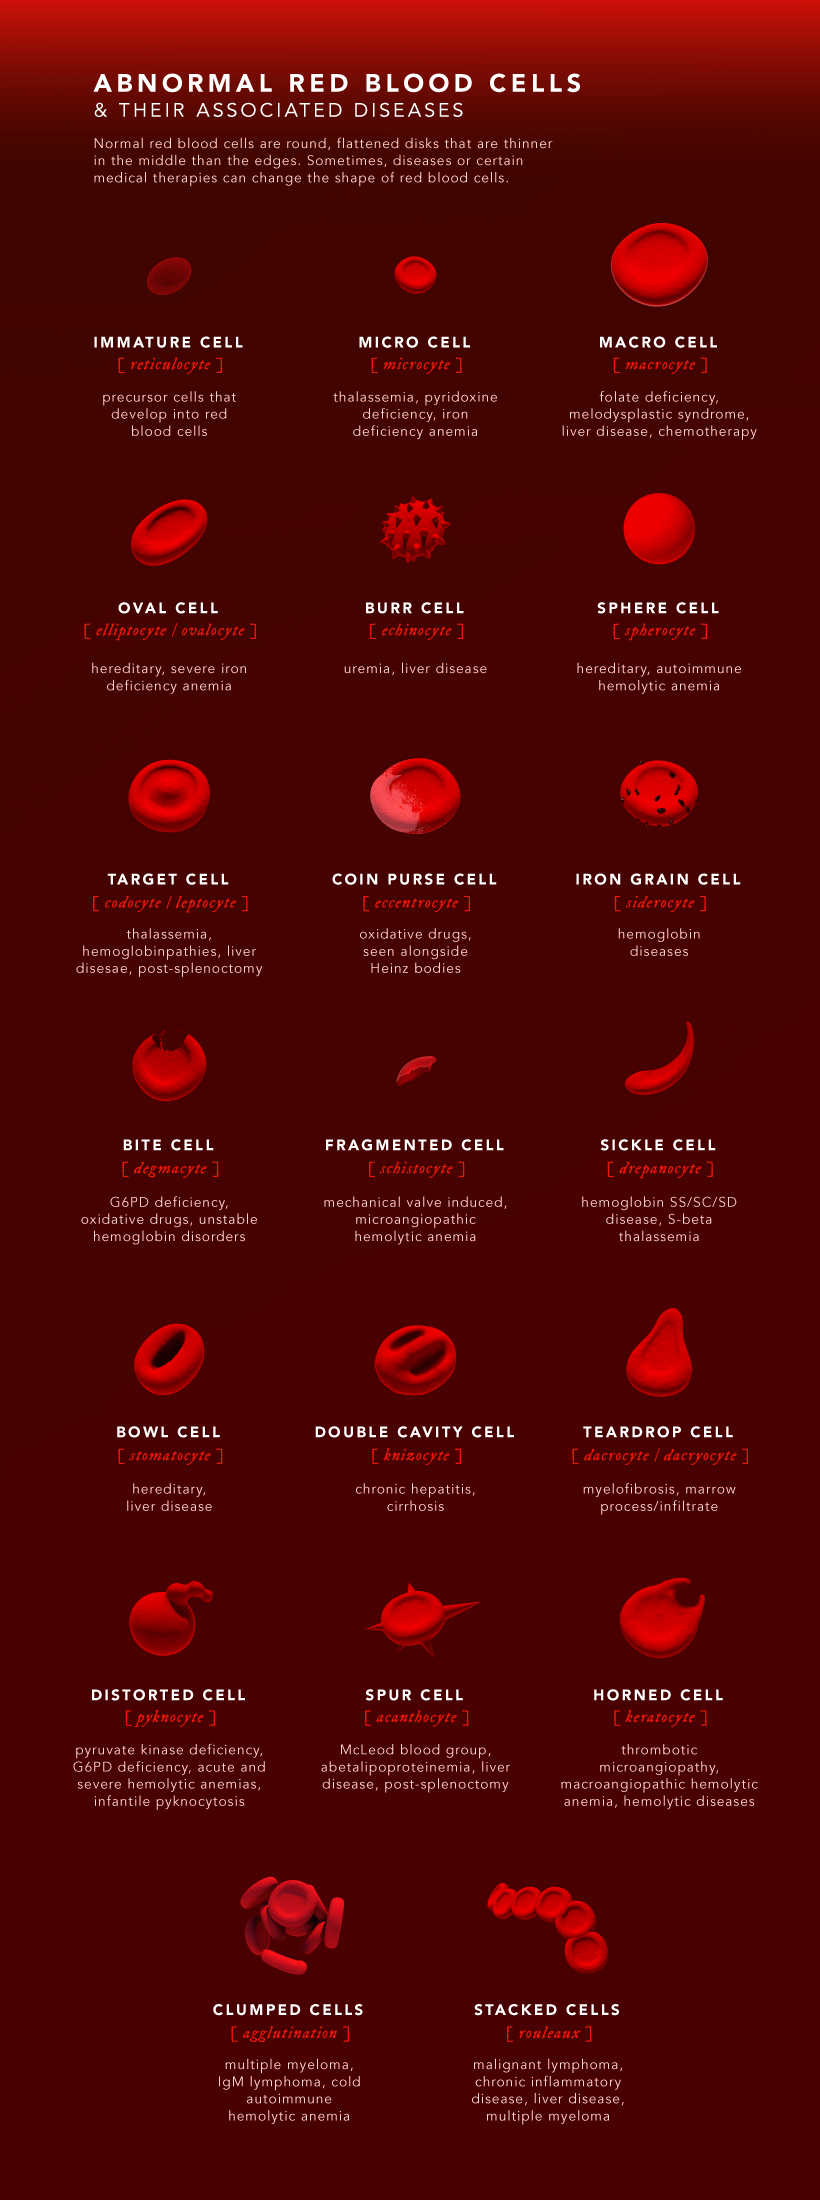
Sickle cell anemia is a well-known disease that affects the shape of red blood cells. Unlike normal, round red blood cells, cells associated with sickle cell disease are crescent- or sickle-shaped, which can slow and block blood flow.
Other common causes of abnormally shaped red blood cells are thalassemia, hereditary blood disorders, iron deficiency anemia, and liver disease. Identifying abnormal blood cells plays an important role in diagnosing the underlying causes and in finding treatments.
The Functions of Blood
We know that blood is vital, but what does it actually do in the body?
For starters, here are some of the functions of blood:
- Blood transports oxygen to different parts of the body, providing an energy source. It also delivers carbon dioxide to the lungs for exhalation.
- The platelets, white blood cells, and plasma proteins in blood play an important role in fighting infections and clotting.
- Blood transports the body’s waste products to the kidneys and liver, which filter it and recirculate clean blood.
- Blood helps regulate the body’s internal temperature by absorbing and distributing heat throughout the body.
While we all know that we can’t live without blood, it serves many different functions in the body that we often don’t notice. For humans and many other organisms alike, blood is an integral component that keeps us alive and going.


population
Charted: The Rapid Decline of Global Birth Rates
For the last 70 years, birth rates for the 49 most populous countries of the world have fallen sharply, heralding an uncertain future.
 Creator Program
Charted: The Rapid Decline in Global Birth Rates
In 1798, British economist Thomas Malthus proposed a groundbreaking theory now known as the “Malthusian Trap”—suggesting that human population growth is exponential and thus would outpace the linear growth of resources such as food supply.
He worried that this runaway population growth would become unsustainable, eventually relying on sudden shock events—wars, disasters, famines—to reset the population to more sustainable levels. And over the next 200 years, the world population skyrocketed from 1 billion to 8 billion people on the planet.
However, as it turns out, no such shock events were required to turn the tide of population growth. Instead, it’s been rapidly declining birth rates across the world that seem to be leading to an unthinkable outcome for Malthus: a gradually plateauing or even shrinking global population.
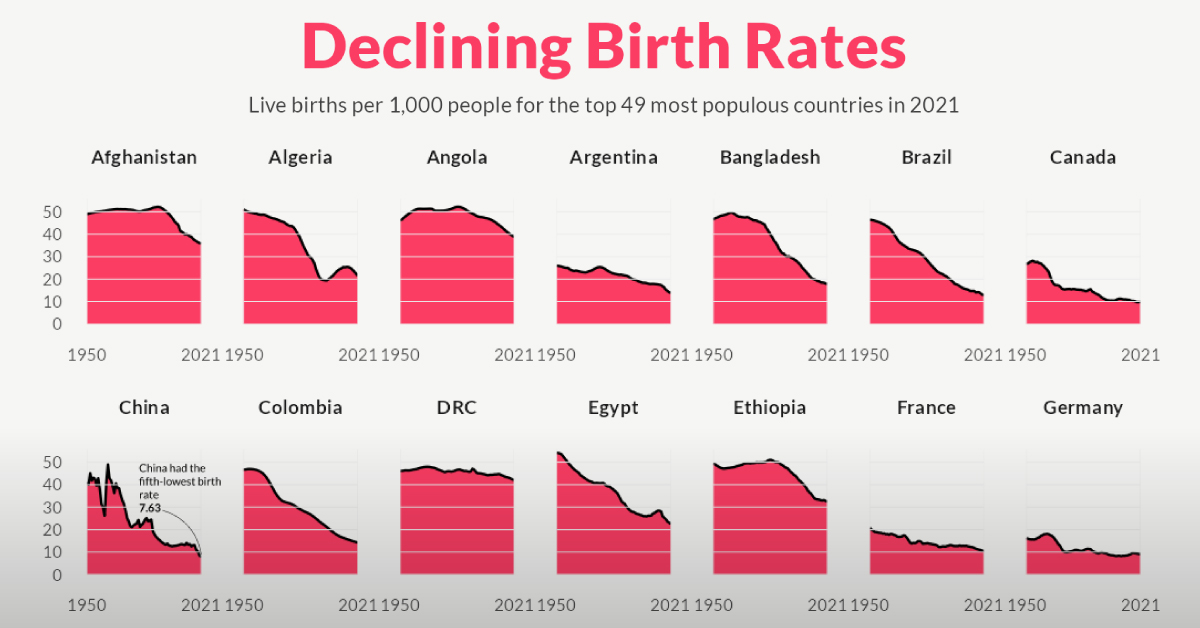
In the visualization above, Pablo Alvarez has visualized the crude birth rate for the 49 most populous countries of the world in 2021, using data from the UN’s World Population Prospects 2022 to examine changes since 1950.
Understanding Birth Rates vs Fertility Rates
Birth rates are commonly measured using a metric called the “crude birth rate” (CBR), which represents the number of live births per 1,000 individuals in a given population during a specific period—usually one year.
The measured decline in CBR is also a result of plummeting fertility rates across the globe. Not to be confused with birth rates, fertility rates measure how many children a woman will have over the course of her lifetime.
While a country’s birth rate is directly impacted by the fertility rate, it also takes into account other factors: population size, age structure of the population, access to contraception, cultural norms, government policies, and socioeconomic conditions.
Birth Rates of the Most Populated Countries
Here’s a snapshot of the CBR for the 49 most populous countries of the world at different years from 1950 to 2021.
| Country | 1950 | 1990 | 2021 | % Change (1950-2021) |
|---|---|---|---|---|
| 🇦🇫 Afghanistan | 48.87 | 51.42 | 35.84 | -27% |
| 🇩🇿 Algeria | 51.05 | 30.76 | 21.52 | -58% |
| 🇦🇴 Angola | 46.15 | 51.34 | 38.81 | -16% |
| 🇦🇷 Argentina | 26.00 | 21.99 | 13.90 | -47% |
| 🇧🇩 Bangladesh | 46.52 | 34.97 | 17.82 | -62% |
| 🇧🇷 Brazil | 46.43 | 24.84 | 12.88 | -72% |
| 🇨🇦 Canada | 26.80 | 15.46 | 9.82 | -63% |
| 🇨🇳 China | 41.05 | 24.44 | 7.63 | -81% |
| 🇨🇴 Colombia | 46.74 | 27.37 | 14.20 | -70% |
| 🇨🇩 DRC | 46.02 | 46.01 | 42.05 | -9% |
| 🇪🇬 Egypt | 54.20 | 33.21 | 22.56 | -58% |
| 🇪🇹 Ethiopia | 49.40 | 50.05 | 32.38 | -34% |
| 🇫🇷 France | 20.77 | 13.34 | 10.50 | -49% |
| 🇩🇪 Germany | 16.22 | 11.30 | 9.17 | -43% |
| 🇬🇭 Ghana | 46.76 | 40.37 | 27.55 | -41% |
| 🇮🇳 India | 43.84 | 31.82 | 16.42 | -63% |
| 🇮🇩 Indonesia | 40.64 | 25.52 | 16.42 | -60% |
| 🇮🇷 Iran | 50.14 | 32.46 | 13.70 | -73% |
| 🇮🇶 Iraq | 45.73 | 39.41 | 27.37 | -40% |
| 🇮🇹 Italy | 19.70 | 10.01 | 6.93 | -65% |
| 🇯🇵 Japan | 28.34 | 9.91 | 6.57 | -77% |
| 🇰🇪 Kenya | 49.47 | 43.52 | 27.68 | -44% |
| 🇲🇾 Malaysia | 44.31 | 27.89 | 15.24 | -66% |
| 🇲🇽 Mexico | 49.31 | 29.30 | 14.86 | -70% |
| 🇲🇦 Morocco | 51.08 | 29.23 | 17.55 | -66% |
| 🇲🇿 Mozambique | 46.66 | 46.38 | 36.60 | -22% |
| 🇲🇲 Myanmar | 45.58 | 27.48 | 17.10 | -62% |
| 🇳🇵 Nepal | 47.06 | 38.11 | 20.40 | -57% |
| 🇳🇬 Nigeria | 45.61 | 43.79 | 37.12 | -19% |
| 🇵🇰 Pakistan | 43.72 | 43.15 | 27.52 | -37% |
| 🇵🇪 Peru | 48.16 | 30.90 | 17.62 | -63% |
| 🇵🇭 Philippines | 49.84 | 33.26 | 21.81 | -56% |
| 🇵🇱 Poland | 30.85 | 14.28 | 9.49 | -69% |
| 🇷🇺 Russia | 28.80 | 13.52 | 9.64 | -67% |
| 🇸🇦 Saudi Arabia | 53.34 | 34.41 | 17.47 | -67% |
| 🇿🇦 South Africa | 41.65 | 31.15 | 19.82 | -52% |
| 🇰🇷 South Korea | 40.03 | 15.69 | 5.58 | -86% |
| 🇪🇸 Spain | 20.01 | 10.30 | 7.55 | -62% |
| 🇸🇩 Sudan | 47.75 | 43.09 | 33.60 | -30% |
| 🇹🇿 Tanzania | 47.75 | 43.78 | 36.21 | -24% |
| 🇹🇭 Thailand | 43.84 | 19.73 | 9.00 | -79% |
| 🇹🇷 Türkiye | 46.39 | 25.87 | 14.68 | -68% |
| 🇺🇸 U.S. | 22.81 | 16.73 | 11.06 | -52% |
| 🇺🇬 Uganda | 52.42 | 51.37 | 36.80 | -30% |
| 🇬🇧 UK | 16.44 | 13.88 | 10.08 | -39% |
| 🇺🇦 Ukraine | 22.95 | 12.76 | 7.72 | -66% |
| 🇺🇿 Uzbekistan | 39.85 | 33.98 | 23.55 | -41% |
| 🇻🇳 Vietnam | 38.82 | 28.51 | 15.01 | -61% |
| 🇾🇪 Yemen | 52.59 | 50.64 | 30.54 | -42% |
Every country on the list has seen a decline in birth rates in the last 70 years, with some declines more staggering than others. For example, China recorded 41 births per 1,000 people in 1950. By 2021, that number had fallen to just 7.6, a 81% decrease.
South Korea, the 29th most populous country in the world in 2021, saw an even larger 86% drop in its birth rate since 1950. In fact, almost every single country in this dataset has seen a double-digit fall in their birth rates over the past 70 years. Only the Democratic Republic of Congo has seen a single-digit percentage decline between 1950 and 2021.
Why are Global Birth Rates Falling?
For the 49 most populated countries in 2021, birth rates have halved on average in the last 70 years:
| 49 Most Populated Countries | 1950 | 1990 | 2021 |
|---|---|---|---|
| Average Birth Rate | 40.99 | 30.18 | 19.50 |
| Median Birth Rate | 45.73 | 30.76 | 17.10 |
But while the thought of a shrinking world population may seem worrisome, declining birth rates are generally thought of as a triumph of rapid socio-economic development.
As countries progress and living standards improve, there is a shift in societal norms and aspirations. For example, expanded education and career opportunities for women allow the pursuit of professional growth and personal goals, with some women choosing to delay starting a family or having smaller families.
Growing urbanization is another key driver of declining birth rates, characterized by smaller living spaces, increased focus on careers, and limited support networks. Another is the growing access to family planning services and contraceptives, particularly since the 1970s.
What are the Future Consequences?
The biggest consequence of declining birth rates—and one that is already being seen in many parts of the world—is a rapidly aging population.
With fewer children being born, the proportion of elderly individuals increases relative to the working-age population. This demographic imbalance poses challenges for social welfare systems, healthcare, and pension schemes.
Declining birth rates can also impact the labor market and economic productivity. A smaller workforce may lead to labor shortages, skill gaps, and reduced innovation. And shrinking populations reduce consumer demand, a cornerstone of the global economy, which may trigger a restructure of the current growth model of development.

-
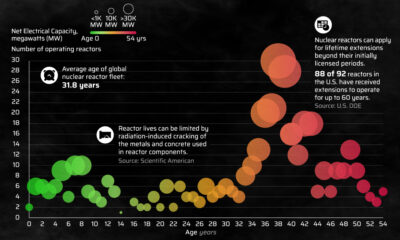
 Energy3 weeks ago
How Old Are the World’s Nuclear Reactors?
-
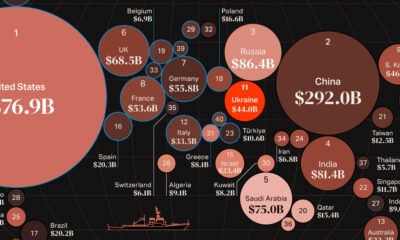
 Countries7 days ago
Mapped: World’s Top 40 Largest Military Budgets
-

 Energy3 weeks ago
How Big is the Market for Crude Oil?
-

 United States6 days ago
Mapped: The Safest Cities in the U.S.
-

 Markets2 weeks ago
Ranked: The Most Profitable U.S. Companies, by Sector
-

 Technology5 days ago
How Long it Took for Popular Apps to Reach 100 Million Users
-

 Markets4 weeks ago
The World’s Biggest Mutual Fund and ETF Providers
-

 Brands2 weeks ago
Brand Reputations: Ranking the Best and Worst in 2023