Base Metals
Ranked: The World’s Biggest Steel Producers, by Country
![]() Subscribe to the Elements free mailing list for more like this
Subscribe to the Elements free mailing list for more like this
Ranked: The World’s Biggest Steel Producers, by Country
This was originally posted on Elements. Sign up to the free mailing list to get beautiful visualizations on real assets and resource megatrends each week.
Steel is a critical component of modern industry and economy, essential for the construction of buildings, automobiles, and many other appliances and infrastructure used in our daily lives.
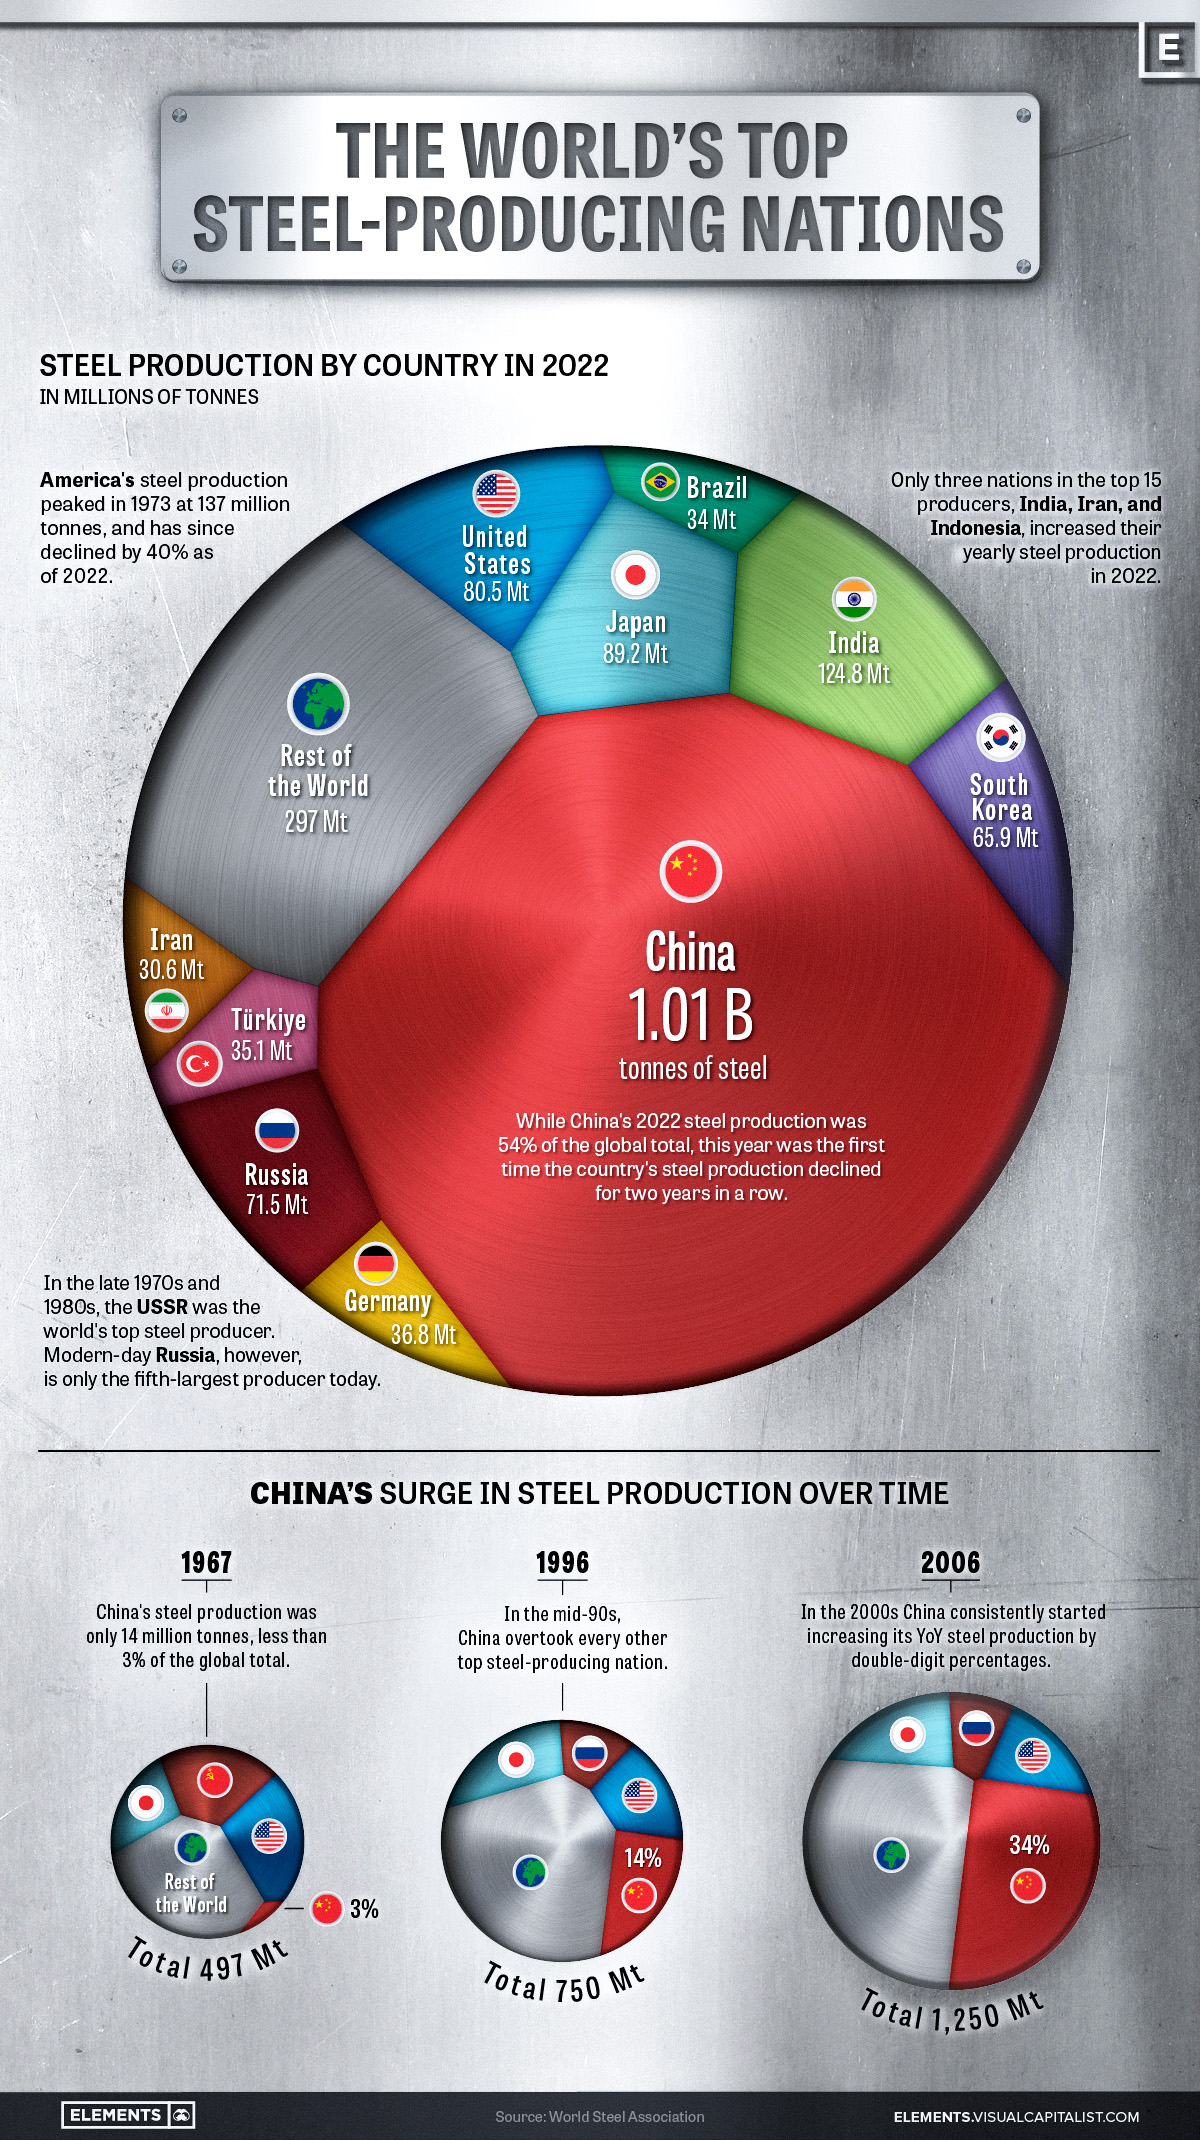
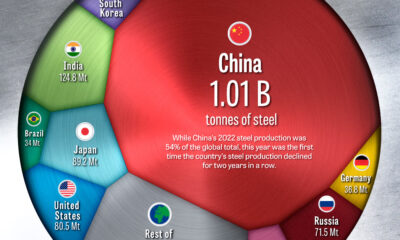
This graphic uses data from the World Steel Association to visualize the world’s top steel-producing countries, and highlights China’s ascent to the top, as it now makes up more than half of the world’s steel production.
The State of Global Steel Production
Global steel production in 2022 reached 1,878 million tonnes, barely surpassing the pre-pandemic production of 1,875 million tonnes in 2019.
| Country | 2022 Production (in million tonnes) | Annual Production Change | Global Share |
|---|---|---|---|
| 🇨🇳 China | 1013.0 | -2.0% | 53.9% |
| 🇮🇳 India | 124.8 | 5.3% | 6.6% |
| 🇯🇵 Japan | 89.2 | -7.9% | 4.8% |
| 🇺🇸 United States | 80.5 | -6.5% | 4.3% |
| 🇷🇺 Russia | 71.5 | -5.8% | 3.8% |
| 🇰🇷 South Korea | 65.9 | -6.9% | 3.5% |
| 🇩🇪 Germany | 36.8 | -8.8% | 2.0% |
| 🇹🇷 Türkiye | 35.1 | -15.0% | 1.9% |
| 🇧🇷 Brazil | 34.0 | -6.5% | 1.8% |
| 🇮🇷 Iran | 30.6 | 6.8% | 1.6% |
| 🇮🇹 Italy | 21.6 | -13.0% | 1.1% |
| 🇹🇼 Taiwan | 20.7 | -12.1% | 1.1% |
| 🇻🇳 Vietnam | 20.0 | -15.0% | 1.1% |
| 🇲🇽 Mexico | 18.2 | -1.9% | 1.0% |
| 🇮🇩 Indonesia | 15.6 | 8.3% | 0.8% |
| Rest of World | 201.0 | -11.2% | 10.7% |
| World Total | 1878.5 | -3.9% | 100.0% |
2022’s steel production marked a significant reduction compared to the post-pandemic rebound of 1,960 million tonnes in 2021, with a year-over-year decline of 4.2%–the largest drop since 2009, and prior to that, 1991.
This decline was spread across many of the world’s top steel producers, with only three of the top fifteen countries, India, Iran, and Indonesia, increasing their yearly production. Most of the other top steel-producing countries saw annual production declines of more than 5%, with Turkey, Italy, Taiwan, and Vietnam’s production all declining by double digits.
Even the world’s top steel-producing nation, China, experienced a modest 2% decline, which due to the country’s large production amounted to a decline of 19.8 million tonnes, more than many other nations produce in a year.
Despite India, the world’s second-largest steel producer, increasing its production by 5.3%, the country’s output still amounts to just over one-tenth of the steel produced by China.
China’s Meteoric Rise in Steel Production
Although China dominates the world’s steel production with more than a 54% share today, this hasn’t always been the case.
In 1967, the World Steel Association’s first recorded year of steel production figures, China only produced an estimated 14 million tonnes, making up barely 3% of global output. At that time, the U.S. and the USSR were competing as the world’s top steel producers at 115 and 102 million tonnes respectively, followed by Japan at 62 million tonnes.
Almost three decades later in 1996, China had successively overtaken Russia, the U.S., and Japan to become the top steel-producing nation with 101 million tonnes of steel produced that year.
The early 2000s marked a period of rapid growth for China, with consistent double-digit percentage increases in steel production each year.
The Recent Decline in China’s Steel Production
Since the early 2000s, China’s average annual growth in steel production has slowed to 3.4% over the last decade (2013-2022), a considerable decline compared to the previous decade’s (2003-2012) 15.2% average annual growth rate.
The past couple of years have seen China’s steel production decline, with 2021 and 2022 marking the first time the country’s production fell for two consecutive years in a row.
While it’s unlikely China will relinquish its position as the top steel-producing nation anytime soon, it remains to be seen whether this recent decline marks the beginning of a new trend or just a brief deviation from the country’s consistent production growth.


Mining
Why Copper and Nickel Are the Key Metals for Energy Utopia
With more renewables and EVs plugging into the grid, copper and nickel are essential building blocks for the energy transition.
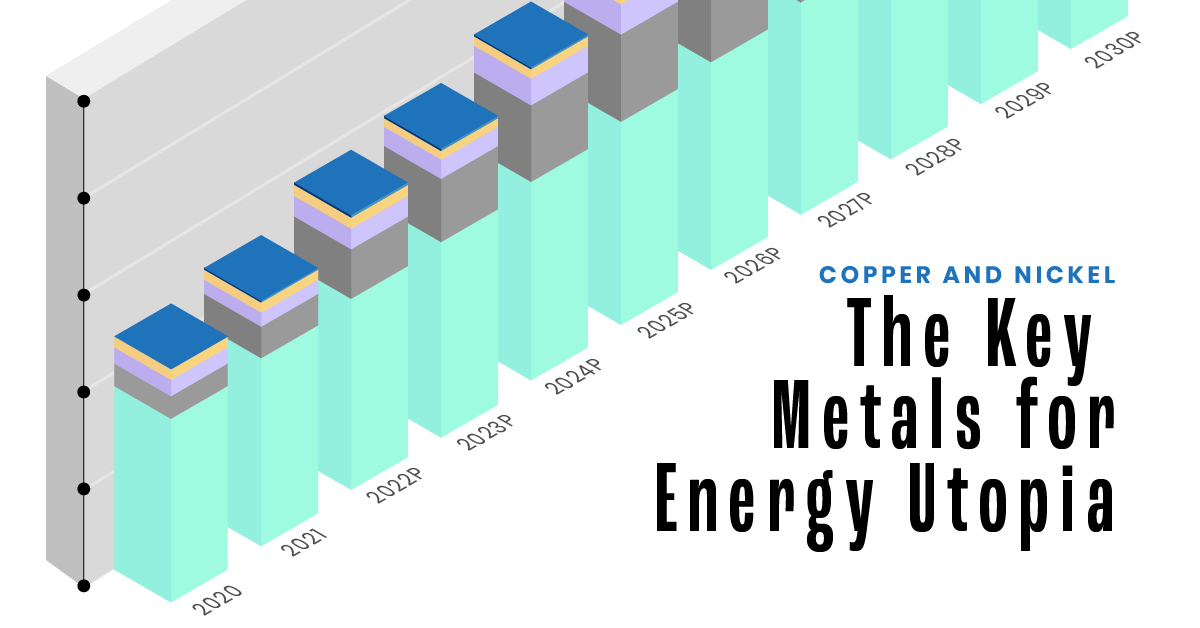


Copper and Nickel: The Key Metals for Energy Utopia
The raw materials required to transport and store clean energy are critical for the energy transition. Copper and nickel are two such metals.
Copper is essential for the transmission and distribution of clean electricity, while nickel powers lithium-ion batteries for EVs and energy storage systems.
The above infographic sponsored by CanAlaska Uranium explores how copper and nickel are enabling green technologies and highlights why they are essential for a utopian energy future.
Copper: Transporting Clean Energy
When it comes to conducting electricity, copper is second only to silver. This property makes it an indispensable building block for multiple energy technologies, including:
- Electric vehicles: On average, a typical electric car contains 53kg of copper, primarily found in the wirings and car components.
- Solar power: Solar panels use 2.8 tonnes of copper per megawatt (MW) of installed capacity, mainly for heat exchangers, wiring, and cabling.
- Wind energy: Onshore wind turbines contain 2.9 tonnes of copper per MW of capacity. Offshore wind turbines, which typically use copper in undersea cables, use 8 tonnes per MW.
- Power grids: Copper, alongside aluminum, is the preferred choice for electric transmission and distribution networks due to its reliability and efficiency.
BloombergNEF projects that, due to its expansive role in clean energy, the demand for copper from clean energy applications will double by 2030 from 2020 levels. The table below compares annual copper demand from clean energy, in tonnes, in 2020 vs. 2030:
| Year | Power Grids | EV batteries | Wind | Solar | EV charging | Total (tonnes) |
|---|---|---|---|---|---|---|
| 2020 | 1,700,000 | 210,000 | 165,000 | 83,000 | 4,200 | 2,162,200 |
| 2030P | 2,000,000 | 1,800,000 | 352,000 | 104,000 | 47,100 | 4,303,100 |
Although power grids will account for the largest portion of annual copper demand through 2030, EV batteries are projected to spearhead the growth.
Nickel: Powering Lithium-ion Batteries
Nickel is a key ingredient in lithium-ion batteries for EVs and stationary energy storage systems. For EVs, nickel-based cathodes offer more energy density and longer driving ranges as compared to cathodes with lower nickel content.
According to Wood Mackenzie, batteries could account for 41% of global nickel demand by 2030, up from just 7% in 2021.
| End-use | 2021 % of Nickel Demand | 2040P % of Nickel Demand |
|---|---|---|
| Stainless steel | 69% | 45% |
| Battery precursors | 7% | 41% |
| Other | 24% | 14% |
Nickel-based cathodes for lithium-ion batteries, including NMC (Nickel Manganese Cobalt) and NCA (Nickel Cobalt Aluminum), are prevalent in EVs and make up more than 50% of the battery cathode chemistry market.
A Bright Future for Copper and Nickel
Both copper and nickel are essential building blocks of EVs and other key technologies for the energy transition and ultimately energy utopia.
As more such technologies are deployed, these metals are likely to be in high demand, with clean energy applications supplementing their existing industrial uses.
CanAlaska is a leading exploration company with a strategic portfolio of uranium, nickel, and copper projects in North America. Click here to learn more.

-
 Energy3 weeks ago
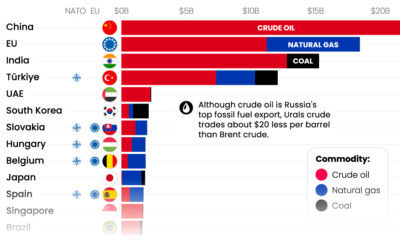
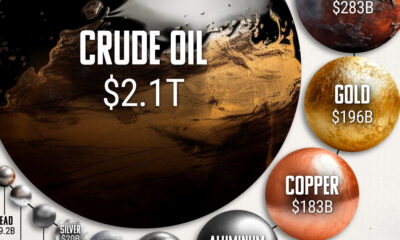
How Big is the Market for Crude Oil?
The oil market is bigger than the 10 largest metal markets combined, with production value exceeding $2 trillion annually.
-
 Base Metals2 months ago
Ranked: The World’s Biggest Steel Producers, by Country
China has dominated global steel production the past few decades, but how did the country get here, and is its production growth over?
-
 Money4 months ago
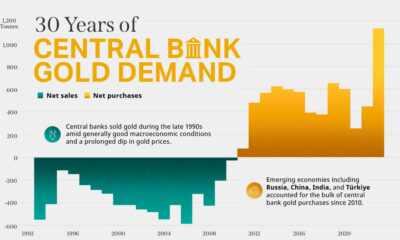
Charted: 30 Years of Central Bank Gold Demand
Globally, central banks bought a record 1,136 tonnes of gold in 2022. How has central bank gold demand changed over the last three decades?
-
 Energy6 months ago
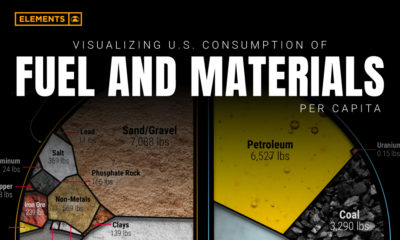
Visualizing U.S. Consumption of Fuel and Materials per Capita
Wealthy countries consume large amounts of natural resources per capita, and the U.S. is no exception. See how much is used per person.
-
 Commodities6 months ago
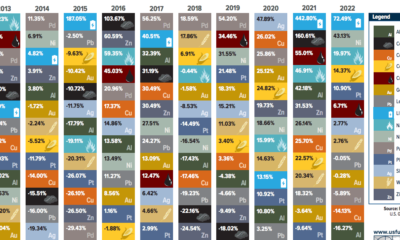
The Periodic Table of Commodity Returns (2013-2022)
This table shows the fluctuating returns for various commodities over the past decade, from energy fuels to industrial and precious metals.
-

 Batteries7 months ago
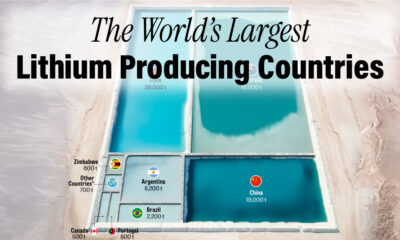
Visualizing 25 Years of Lithium Production, by Country
Lithium production has grown exponentially over the last few decades. Which countries produce the most lithium, and how how has this mix evolved?

-
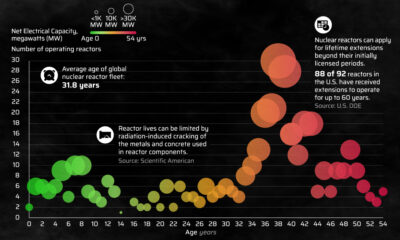
 Energy3 weeks ago
How Old Are the World’s Nuclear Reactors?
-
 War7 days ago
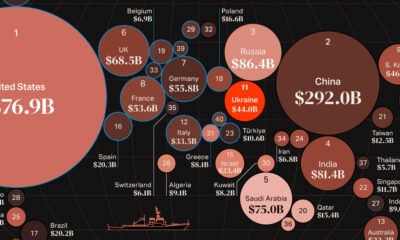
Mapped: World’s Top 40 Largest Military Budgets
-
Energy3 weeks ago
How Big is the Market for Crude Oil?
-

 Crime7 days ago
Mapped: The Safest Cities in the U.S.
-
 Markets2 weeks ago
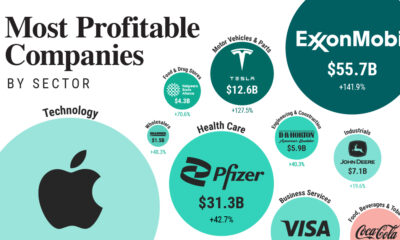
Ranked: The Most Profitable U.S. Companies, by Sector
-
 Technology5 days ago
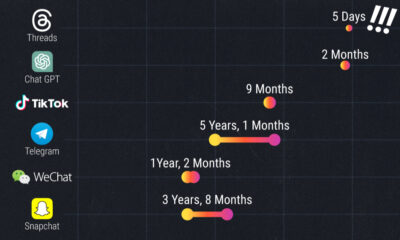
How Long it Took for Popular Apps to Reach 100 Million Users
-
 Markets4 weeks ago
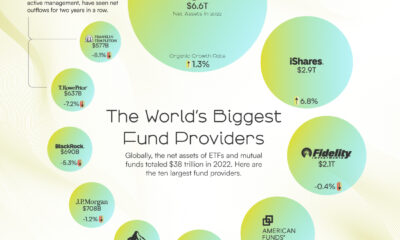
The World’s Biggest Mutual Fund and ETF Providers
-

 Brands2 weeks ago
Brand Reputations: Ranking the Best and Worst in 2023