Agriculture
Mapped: Meat Consumption By Country and Type
Article/Editing:
Mapped: Meat Consumption By Country and Type
Meat is always on the menu in many parts of the world, as we can see when we map out meat consumption by country.
How do countries differ in how much, and what type of meat, they eat? In this colorful graphic, our creator theWORLDMAPS highlights the most consumed type of meat in every country in the world, using data from the UN’s Food and Agriculture Organization (FAO).
Each color denotes a different category of meat—beef, pork, mutton, poultry, seafood, or other—with annual consumption calculated per capita in kilograms (kg).
Let’s dig in to the data.
Is Fish Considered Meat?
Since meat is normally defined as the flesh of any animal (with the primary components being water, fat, and protein), that includes fish and other seafood.
But whether fish is considered “meat” or not depends a lot on cultural practices and dietary preferences, and has varied throughout history. Some earlier definitions of meat focused only on mammals, for example.
In Christianity for example, many denominations allow eating fish on fasting days when abstaining from meat. This was both due to distinctions between meat from warm-blooded land animals and cold-blooded animals (like fish), as well as the importance of fish consumption in parts of Europe where Christianity flourished.
To account for both sides of the debate, we’ll cover meat consumption by country both with and without fish and seafood.
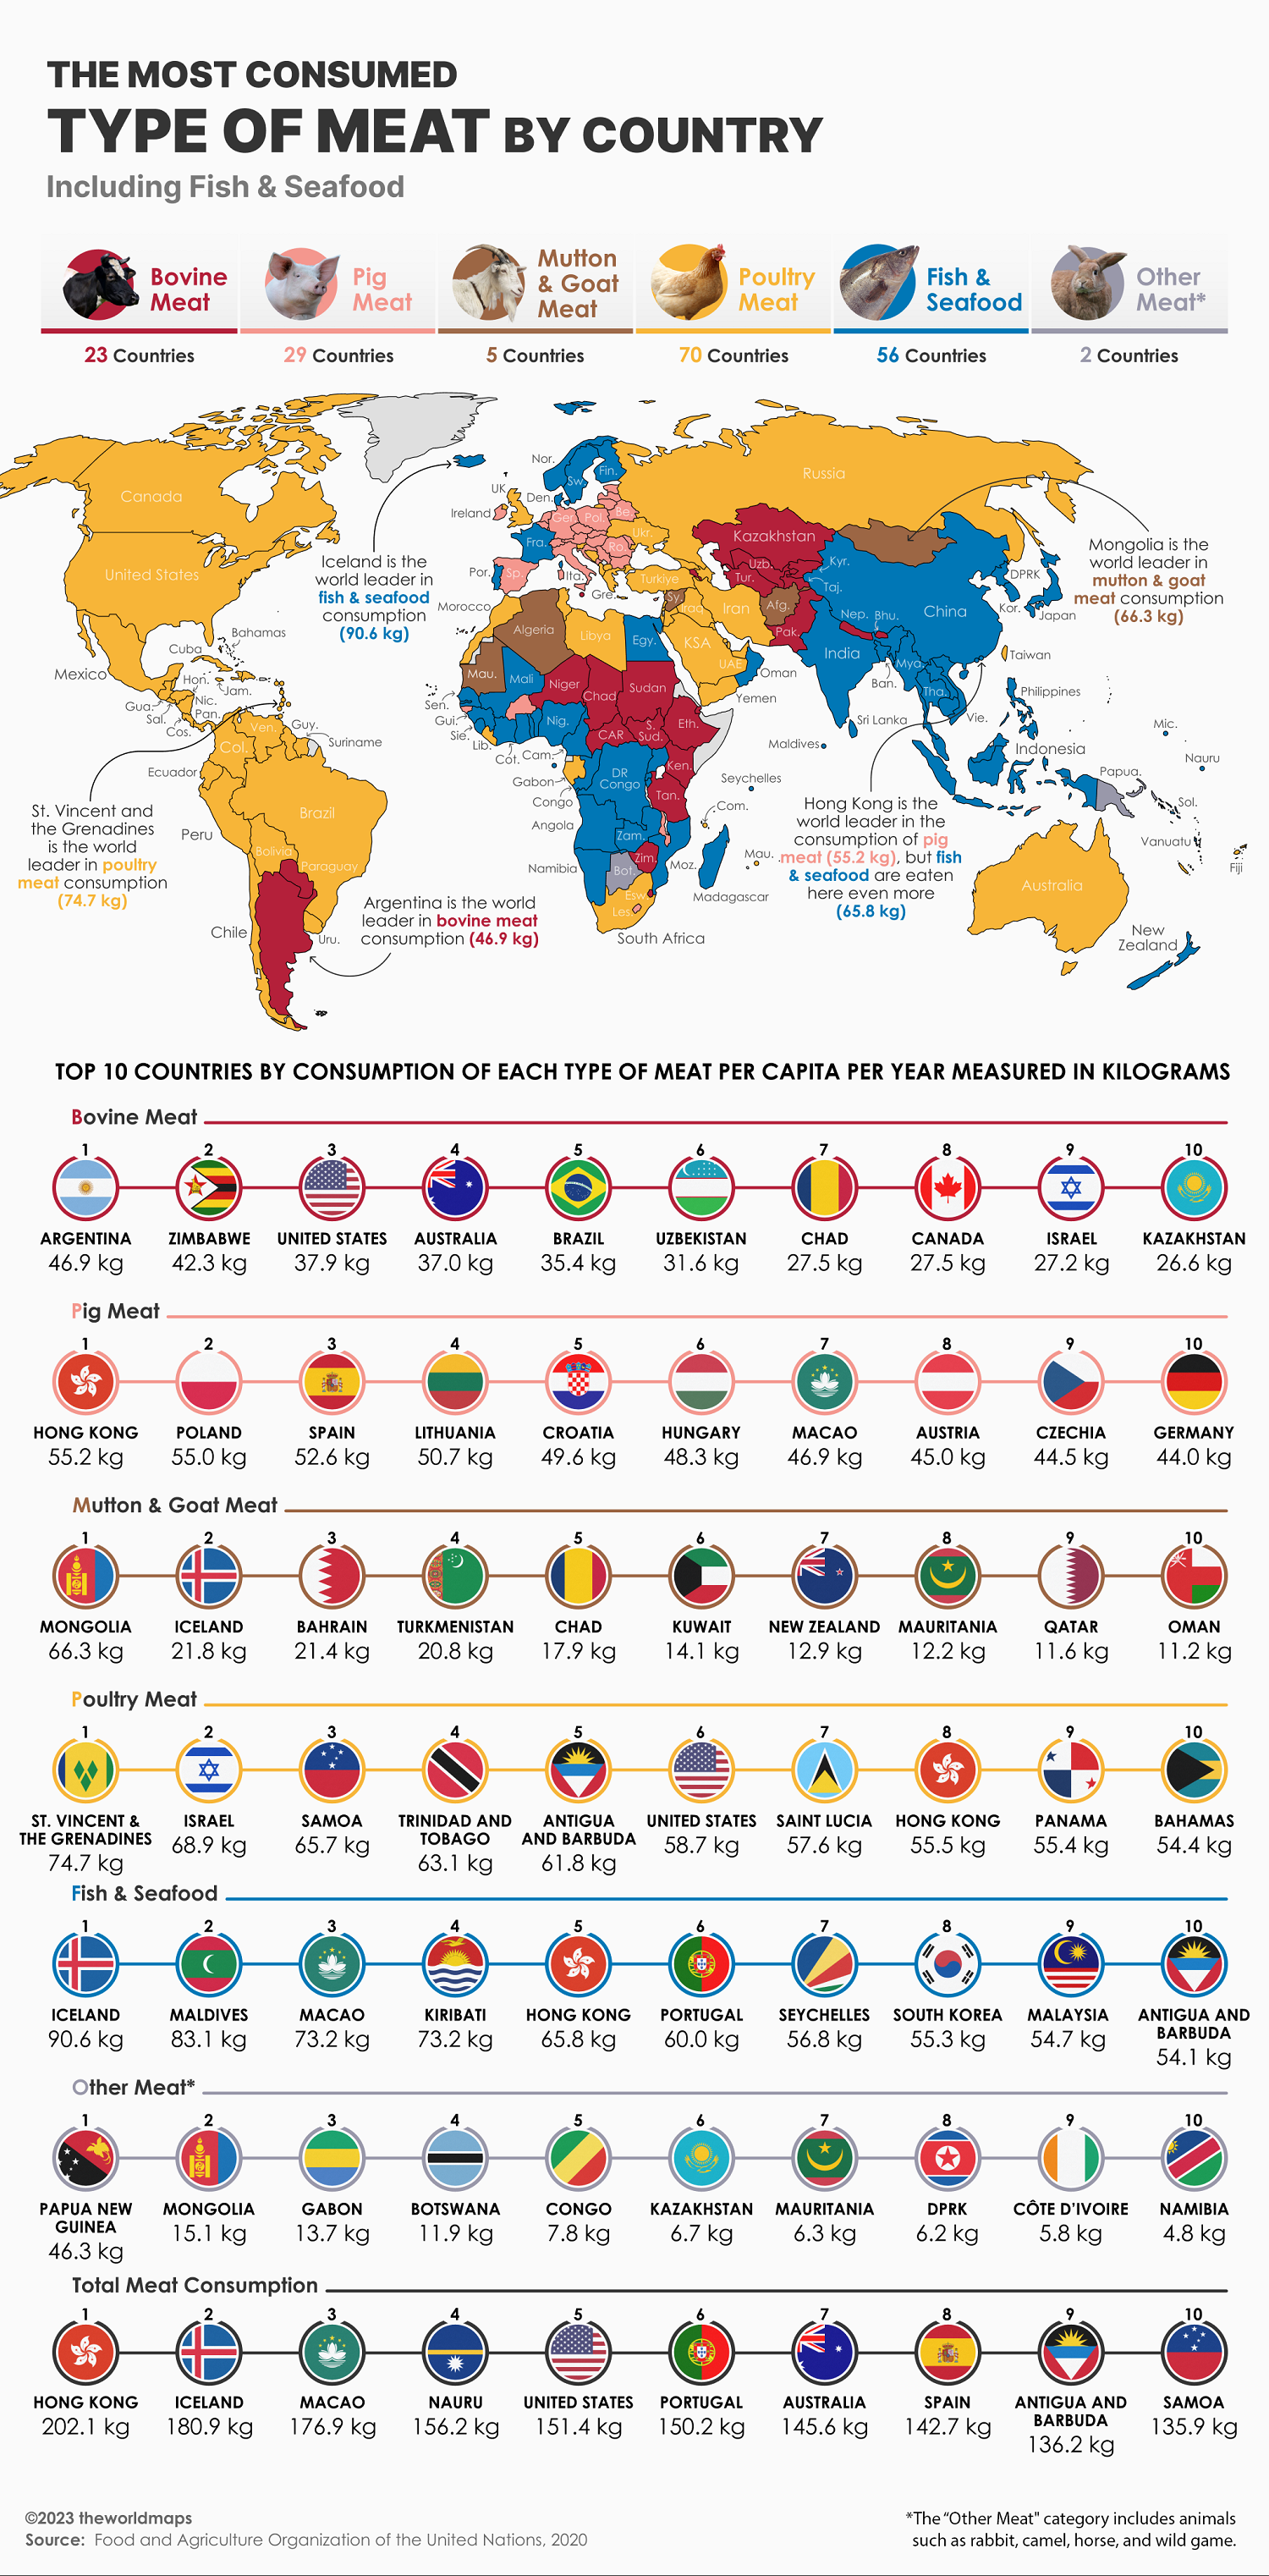
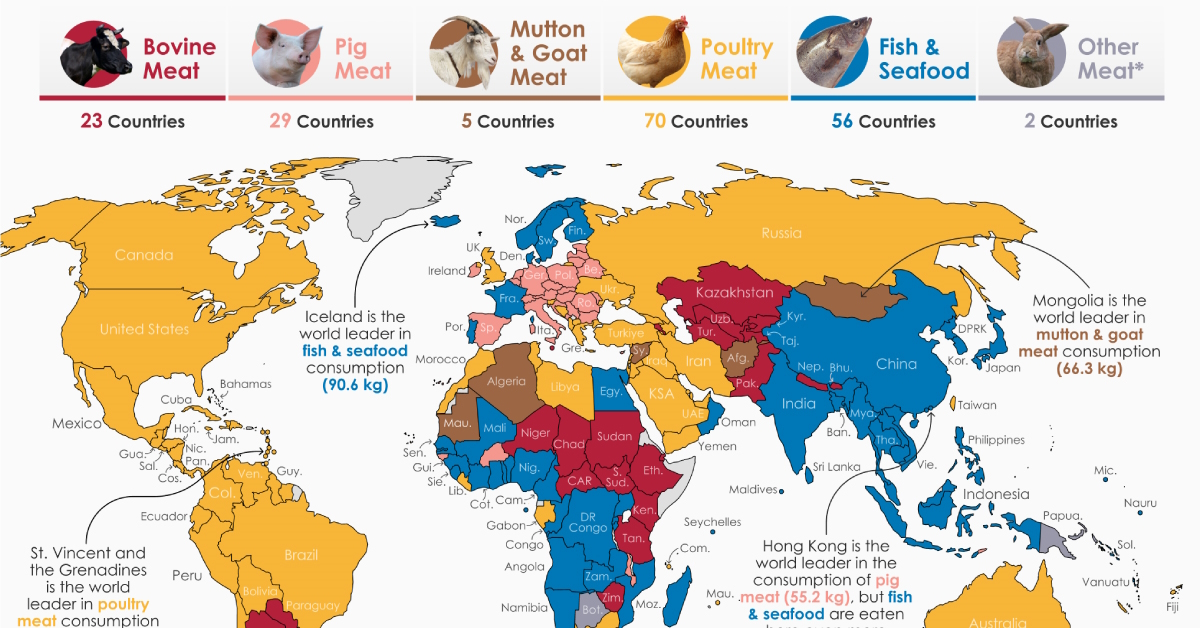
The Most Consumed Meat by Country (Including Seafood)
Just by glancing at the map and the below table, poultry stands out as the most popular meat by weight consumption in 70 countries, or about 40% of the entire database.
Note: Other meat includes less frequently farmed animals like rabbit, horse, and camel, as well as game—meat from wild animals.
| Country | Most Consumed Meat |
|---|---|
| 🇦🇫 Afghanistan | Mutton & Goat |
| 🇦🇱 Albania | Poultry |
| 🇩🇿 Algeria | Mutton & Goat |
| 🇦🇴 Angola | Fish & Seafood |
| 🇦🇬 Antigua & Barbuda | Poultry |
| 🇦🇷 Argentina | Bovine |
| 🇦🇲 Armenia | Bovine |
| 🇦🇺 Australia | Poultry |
| 🇦🇹 Austria | Pork |
| 🇦🇿 Azerbaijan | Poultry |
| 🇧🇸 Bahamas | Poultry |
| 🇧🇭 Bahrain | Poultry |
| 🇧🇩 Bangladesh | Fish & Seafood |
| 🇧🇧 Barbados | Poultry |
| 🇧🇾 Belarus | Pork |
| 🇧🇪 Belgium | Pork |
| 🇧🇿 Belize | Poultry |
| 🇧🇯 Benin | Fish & Seafood |
| 🇧🇹 Bhutan | Bovine |
| 🇧🇴 Bolivia | Poultry |
| 🇧🇦 Bosnia & Herzegovina | Poultry |
| 🇧🇼 Botswana | Other |
| 🇧🇷 Brazil | Poultry |
| 🇧🇬 Bulgaria | Pork |
| 🇧🇫 Burkina Faso | Pork |
| 🇧🇮 Burundi | Fish & Seafood |
| 🇨🇻 Cabo Verde | Poultry |
| 🇰🇭 Cambodia | Fish & Seafood |
| 🇨🇲 Cameroon | Fish & Seafood |
| 🇨🇦 Canada | Poultry |
| 🇨🇫 Central African Republic | Bovine |
| 🇹🇩 Chad | Bovine |
| 🇨🇱 Chile | Poultry |
| 🇨🇳 China | Fish & Seafood |
| 🇨🇴 Colombia | Poultry |
| 🇰🇲 Comoros | Poultry |
| 🇨🇬 Congo | Fish & Seafood |
| 🇨🇷 Costa Rica | Poultry |
| 🇨🇮 Côte d’Ivoire | Fish & Seafood |
| 🇭🇷 Croatia | Pork |
| 🇨🇺 Cuba | Poultry |
| 🇨🇾 Cyprus | Pork |
| 🇨🇿 Czechia | Pork |
| 🇩🇰 Denmark | Fish & Seafood |
| 🇩🇯 Djibouti | Bovine |
| 🇩🇲 Dominica | Poultry |
| 🇩🇴 Dominican Republic | Poultry |
| 🇨🇩 DR Congo | Fish & Seafood |
| 🇪🇨 Ecuador | Poultry |
| 🇪🇬 Egypt | Fish & Seafood |
| 🇸🇻 El Salvador | Poultry |
| 🇪🇪 Estonia | Pork |
| 🇸🇿 Eswatini | Bovine |
| 🇪🇹 Ethiopia | Bovine |
| 🇫🇯 Fiji | Poultry |
| 🇫🇮 Finland | Fish & Seafood |
| 🇫🇷 France | Fish & Seafood |
| 🇵🇫 French Polynesia | Poultry |
| 🇬🇦 Gabon | Poultry |
| 🇬🇲 Gambia | Fish & Seafood |
| 🇬🇪 Georgia | Poultry |
| 🇩🇪 Germany | Pork |
| 🇬🇭 Ghana | Fish & Seafood |
| 🇬🇷 Greece | Poultry |
| 🇬🇩 Grenada | Poultry |
| 🇬🇹 Guatemala | Poultry |
| 🇬🇳 Guinea | Fish & Seafood |
| 🇬🇼 Guinea-Bissau | Pork |
| 🇬🇾 Guyana | Poultry |
| 🇭🇹 Haiti | Poultry |
| 🇭🇳 Honduras | Poultry |
| 🇭🇰 Hong Kong | Fish & Seafood |
| 🇭🇺 Hungary | Pork |
| 🇮🇸 Iceland | Fish & Seafood |
| 🇮🇳 India | Fish & Seafood |
| 🇮🇩 Indonesia | Fish & Seafood |
| 🇮🇷 Iran | Poultry |
| 🇮🇶 Iraq | Poultry |
| 🇮🇪 Ireland | Pork |
| 🇮🇱 Israel | Poultry |
| 🇮🇹 Italy | Pork |
| 🇯🇲 Jamaica | Poultry |
| 🇯🇵 Japan | Fish & Seafood |
| 🇯🇴 Jordan | Poultry |
| 🇰🇿 Kazakhstan | Bovine |
| 🇰🇪 Kenya | Bovine |
| 🇰🇮 Kiribati | Fish & Seafood |
| 🇰🇼 Kuwait | Poultry |
| 🇰🇬 Kyrgyzstan | Bovine |
| 🇱🇦 Laos | Fish & Seafood |
| 🇱🇻 Latvia | Pork |
| 🇱🇧 Lebanon | Poultry |
| 🇱🇸 Lesotho | Pork |
| 🇱🇷 Liberia | Poultry |
| 🇱🇾 Libya | Poultry |
| 🇱🇹 Lithuania | Pork |
| 🇱🇺 Luxembourg | Pork |
| 🇲🇴 Macao | Fish & Seafood |
| 🇲🇬 Madagascar | Fish & Seafood |
| 🇲🇼 Malawi | Pork |
| 🇲🇾 Malaysia | Fish & Seafood |
| 🇲🇻 Maldives | Fish & Seafood |
| 🇲🇱 Mali | Fish & Seafood |
| 🇲🇹 Malta | Bovine |
| 🇲🇷 Mauritania | Mutton & Goat |
| 🇲🇺 Mauritius | Poultry |
| 🇲🇽 Mexico | Poultry |
| 🇫🇲 Micronesia | Fish & Seafood |
| 🇲🇩 Moldova | Pork |
| 🇲🇳 Mongolia | Mutton & Goat |
| 🇲🇪 Montenegro | Pork |
| 🇲🇦 Morocco | Poultry |
| 🇲🇿 Mozambique | Fish & Seafood |
| 🇲🇲 Myanmar | Fish & Seafood |
| 🇳🇦 Namibia | Fish & Seafood |
| 🇳🇷 Nauru | Fish & Seafood |
| 🇳🇵 Nepal | Bovine |
| 🇳🇱 Netherlands | Pork |
| 🇳🇨 New Caledonia | Poultry |
| 🇳🇿 New Zealand | Fish & Seafood |
| 🇳🇮 Nicaragua | Poultry |
| 🇳🇪 Niger | Bovine |
| 🇳🇬 Nigeria | Fish & Seafood |
| 🇰🇵 North Korea | Fish & Seafood |
| 🇲🇰 North Macedonia | Poultry |
| 🇳🇴 Norway | Fish & Seafood |
| 🇴🇲 Oman | Fish & Seafood |
| 🇵🇰 Pakistan | Bovine |
| 🇵🇦 Panama | Poultry |
| 🇵🇬 Papua New Guinea | Other |
| 🇵🇾 Paraguay | Bovine |
| 🇵🇪 Peru | Poultry |
| 🇵🇭 Philippines | Fish & Seafood |
| 🇵🇱 Poland | Pork |
| 🇵🇹 Portugal | Fish & Seafood |
| 🇶🇦 Qatar | Poultry |
| 🇷🇴 Romania | Pork |
| 🇷🇺 Russia | Poultry |
| 🇷🇼 Rwanda | Fish & Seafood |
| 🇰🇳 Saint Kitts & Nevis | Poultry |
| 🇱🇨 Saint Lucia | Poultry |
| 🇻🇨 Saint Vincent & the Grenadines | Poultry |
| 🇼🇸 Samoa | Poultry |
| 🇸🇹 Sao Tome & Principe | Fish & Seafood |
| 🇸🇦 Saudi Arabia | Poultry |
| 🇸🇳 Senegal | Fish & Seafood |
| 🇷🇸 Serbia | Pork |
| 🇸🇨 Seychelles | Fish & Seafood |
| 🇸🇱 Sierra Leone | Fish & Seafood |
| 🇸🇰 Slovakia | Pork |
| 🇸🇮 Slovenia | Poultry |
| 🇸🇧 Solomon Islands | Fish & Seafood |
| 🇿🇦 South Africa | Poultry |
| 🇰🇷 South Korea | Fish & Seafood |
| 🇸🇸 South Sudan | Bovine |
| 🇪🇸 Spain | Pork |
| 🇱🇰 Sri Lanka | Fish & Seafood |
| 🇸🇩 Sudan | Bovine |
| 🇸🇷 Suriname | Poultry |
| 🇸🇪 Sweden | Fish & Seafood |
| 🇨🇭 Switzerland | Pork |
| 🇸🇾 Syria | Mutton & Goat |
| 🇹🇼 Taiwan | Poultry |
| 🇹🇯 Tajikistan | Bovine |
| 🇹🇿 Tanzania | Bovine |
| 🇹🇭 Thailand | Fish & Seafood |
| 🇹🇱 Timor-Leste | Pork |
| 🇹🇬 Togo | Fish & Seafood |
| 🇹🇹 Trinidad & Tobago | Poultry |
| 🇹🇳 Tunisia | Poultry |
| 🇹🇷 Türkiye | Poultry |
| 🇹🇲 Turkmenistan | Bovine |
| 🇺🇸 U.S. | Poultry |
| 🇦🇪 UAE | Poultry |
| 🇺🇬 Uganda | Fish & Seafood |
| 🇬🇧 UK | Poultry |
| 🇺🇦 Ukraine | Poultry |
| 🇺🇾 Uruguay | Poultry |
| 🇺🇿 Uzbekistan | Bovine |
| 🇻🇺 Vanuatu | Fish & Seafood |
| 🇻🇪 Venezuela | Poultry |
| 🇻🇳 Vietnam | Fish & Seafood |
| 🇾🇪 Yemen | Poultry |
| 🇿🇲 Zambia | Fish & Seafood |
| 🇿🇼 Zimbabwe | Bovine |
Fish & Seafood ranks as the second most popularly consumed meat in 56 countries, most of them with significant coastlines.
Here’s a breakdown of how much of each type of meat is eaten per capita in each country, measured in kilograms.
| Country | Poultry | Pork | Fish & Seafood | Bovine | Mutton & Other |
|---|---|---|---|---|---|
| 🇦🇫 Afghanistan | 1.7 | 0.0 | 0.4 | 3.2 | 4.3 |
| 🇦🇱 Albania | 13.9 | 5.3 | 8.7 | 11.7 | 8.3 |
| 🇩🇿 Algeria | 6.4 | 0.0 | 3.8 | 3.8 | 8.4 |
| 🇦🇴 Angola | 8.4 | 7.0 | 14.1 | 3.4 | 1.1 |
| 🇦🇬 Antigua & Barbuda | 61.8 | 14.3 | 54.1 | 5.0 | 1.0 |
| 🇦🇷 Argentina | 46.2 | 14.4 | 6.8 | 46.9 | 2.6 |
| 🇦🇲 Armenia | 15.3 | 8.1 | 5.5 | 23.9 | 3.6 |
| 🇦🇺 Australia | 48.7 | 24.2 | 24.1 | 37.0 | 11.5 |
| 🇦🇹 Austria | 15.7 | 45.0 | 14.3 | 14.9 | 1.4 |
| 🇦🇿 Azerbaijan | 14.4 | 0.6 | 2.0 | 13.5 | 8.4 |
| 🇧🇸 Bahamas | 54.4 | 23.8 | 24.2 | 5.2 | 1.7 |
| 🇧🇭 Bahrain | 44.0 | 0.8 | 16.3 | 13.7 | 22.2 |
| 🇧🇩 Bangladesh | 1.6 | 0.0 | 26.7 | 1.3 | 1.4 |
| 🇧🇧 Barbados | 49.3 | 12.3 | 42.9 | 8.0 | 3.4 |
| 🇧🇾 Belarus | 32.2 | 39.2 | 11.8 | 18.6 | 0.4 |
| 🇧🇪 Belgium | 12.4 | 32.8 | 22.7 | 14.0 | 2.6 |
| 🇧🇿 Belize | 23.8 | 20.8 | 13.3 | 3.6 | 0.3 |
| 🇧🇯 Benin | 8.7 | 0.7 | 16.2 | 3.6 | 1.5 |
| 🇧🇹 Bhutan | 4.6 | 1.9 | 7.3 | 9.3 | 0.3 |
| 🇧🇴 Bolivia | 40.9 | 9.7 | 2.8 | 21.6 | 4.9 |
| 🇧🇦 Bosnia & Herzegovina | 20.0 | 9.3 | 7.3 | 12.8 | 0.6 |
| 🇧🇼 Botswana | 3.5 | 0.5 | 2.6 | 10.2 | 14.3 |
| 🇧🇷 Brazil | 48.4 | 14.2 | 8.1 | 35.4 | 1.2 |
| 🇧🇬 Bulgaria | 21.5 | 30.0 | 7.4 | 3.5 | 2.0 |
| 🇧🇫 Burkina Faso | 9.5 | 15.2 | 8.9 | 5.3 | 4.3 |
| 🇧🇮 Burundi | 0.6 | 0.9 | 2.6 | 0.9 | 0.8 |
| 🇨🇻 Cabo Verde | 19.4 | 7.3 | 10.8 | 1.7 | 1.9 |
| 🇰🇭 Cambodia | 2.8 | 5.9 | 45.8 | 4.2 | 0.0 |
| 🇨🇲 Cameroon | 3.3 | 1.2 | 19.1 | 3.1 | 4.0 |
| 🇨🇦 Canada | 40.1 | 21.4 | 20.7 | 27.5 | 1.6 |
| 🇨🇫 Central African Republic | 2.6 | 4.1 | 7.4 | 20.8 | 10.4 |
| 🇹🇩 Chad | 0.5 | 0.2 | 6.6 | 27.5 | 18.7 |
| 🇨🇱 Chile | 36.1 | 22.1 | 14.8 | 23.7 | 1.3 |
| 🇨🇳 China | 15.6 | 35.5 | 39.9 | 6.8 | 4.2 |
| 🇨🇴 Colombia | 33.8 | 10.5 | 8.9 | 13.7 | 0.1 |
| 🇰🇲 Comoros | 26.8 | 0.1 | 14.3 | 3.0 | 1.2 |
| 🇨🇬 Congo | 23.2 | 6.8 | 24.5 | 1.9 | 8.1 |
| 🇨🇷 Costa Rica | 34.3 | 12.7 | 18.0 | 11.4 | 0.0 |
| 🇨🇮 Côte d’Ivoire | 2.9 | 1.0 | 23.2 | 1.4 | 6.5 |
| 🇭🇷 Croatia | 16.6 | 49.6 | 19.1 | 11.2 | 2.1 |
| 🇨🇺 Cuba | 37.7 | 21.6 | 6.1 | 7.4 | 4.9 |
| 🇨🇾 Cyprus | 28.4 | 36.8 | 25.5 | 5.9 | 4.6 |
| 🇨🇿 Czechia | 23.5 | 44.5 | 10.5 | 10.2 | 0.9 |
| 🇩🇰 Denmark | 24.6 | 13.5 | 26.5 | 24.3 | 1.3 |
| 🇩🇯 Djibouti | 3.6 | 0.1 | 3.5 | 6.2 | 5.4 |
| 🇩🇲 Dominica | 39.4 | 11.4 | 27.9 | 8.1 | 1.1 |
| 🇩🇴 Dominican Republic | 32.2 | 9.9 | 8.5 | 6.3 | 0.2 |
| 🇨🇩 DR Congo | 1.3 | 0.5 | 4.2 | 0.3 | 1.2 |
| 🇪🇨 Ecuador | 18.9 | 12.9 | 8.2 | 13.3 | 0.4 |
| 🇪🇬 Egypt | 14.3 | 0.0 | 27.1 | 7.4 | 1.5 |
| 🇸🇻 El Salvador | 25.9 | 4.7 | 6.5 | 8.2 | 0.0 |
| 🇪🇪 Estonia | 21.1 | 37.7 | 14.7 | 8.5 | 0.5 |
| 🇸🇿 Eswatini | 7.3 | 2.0 | 4.3 | 16.1 | 2.0 |
| 🇪🇹 Ethiopia | 0.6 | 0.0 | 0.5 | 3.8 | 3.5 |
| 🇫🇯 Fiji | 28.8 | 3.7 | 26.5 | 3.1 | 5.3 |
| 🇫🇮 Finland | 21.1 | 30.8 | 33.5 | 18.4 | 1.1 |
| 🇫🇷 France | 23.0 | 31.0 | 33.2 | 20.8 | 3.5 |
| 🇵🇫 French Polynesia | 48.8 | 14.3 | 47.3 | 21.4 | 3.7 |
| 🇬🇦 Gabon | 39.7 | 8.3 | 28.7 | 4.7 | 14.3 |
| 🇬🇲 Gambia | 10.6 | 0.3 | 25.2 | 3.4 | 1.1 |
| 🇬🇪 Georgia | 18.2 | 9.3 | 10.0 | 5.8 | 1.8 |
| 🇩🇪 Germany | 18.3 | 44.0 | 12.6 | 14.6 | 1.8 |
| 🇬🇭 Ghana | 11.6 | 1.2 | 24.9 | 1.6 | 4.2 |
| 🇬🇷 Greece | 25.6 | 25.0 | 21.7 | 14.5 | 9.4 |
| 🇬🇩 Grenada | 37.4 | 14.6 | 33.8 | 4.1 | 1.4 |
| 🇬🇹 Guatemala | 28.7 | 3.6 | 3.0 | 11.7 | 0.3 |
| 🇬🇳 Guinea | 2.7 | 0.2 | 9.7 | 8.2 | 2.8 |
| 🇬🇼 Guinea-Bissau | 3.1 | 7.2 | 1.2 | 3.7 | 1.3 |
| 🇬🇾 Guyana | 41.4 | 5.0 | 25.0 | 4.2 | 1.2 |
| 🇭🇹 Haiti | 10.9 | 4.0 | 5.0 | 4.2 | 0.9 |
| 🇭🇳 Honduras | 21.6 | 5.0 | 2.6 | 6.0 | 0.1 |
| 🇭🇰 Hong Kong | 55.5 | 55.2 | 65.8 | 22.5 | 3.0 |
| 🇭🇺 Hungary | 29.8 | 48.3 | 6.4 | 4.6 | 0.3 |
| 🇮🇸 Iceland | 30.0 | 21.8 | 90.6 | 14.0 | 24.4 |
| 🇮🇳 India | 2.6 | 0.2 | 8.0 | 1.1 | 0.6 |
| 🇮🇩 Indonesia | 13.7 | 0.9 | 44.4 | 2.8 | 0.5 |
| 🇮🇷 Iran | 26.0 | 0.0 | 12.6 | 7.6 | 4.5 |
| 🇮🇶 Iraq | 5.4 | 0.0 | 3.6 | 3.1 | 1.7 |
| 🇮🇪 Ireland | 24.7 | 31.1 | 22.6 | 19.8 | 3.6 |
| 🇮🇱 Israel | 68.9 | 1.6 | 24.7 | 27.2 | 1.7 |
| 🇮🇹 Italy | 19.6 | 32.9 | 29.2 | 15.9 | 1.8 |
| 🇯🇲 Jamaica | 53.9 | 3.1 | 25.2 | 3.8 | 0.7 |
| 🇯🇵 Japan | 22.3 | 21.3 | 46.2 | 9.6 | 0.3 |
| 🇯🇴 Jordan | 26.1 | 0.0 | 5.1 | 6.8 | 4.8 |
| 🇰🇿 Kazakhstan | 21.2 | 8.2 | 2.8 | 26.6 | 15.9 |
| 🇰🇪 Kenya | 1.3 | 0.4 | 2.9 | 4.5 | 4.5 |
| 🇰🇮 Kiribati | 26.6 | 10.3 | 73.2 | 1.9 | 0.3 |
| 🇰🇼 Kuwait | 46.6 | 0.0 | 14.0 | 9.4 | 16.7 |
| 🇰🇬 Kyrgyzstan | 5.2 | 2.1 | 1.1 | 14.9 | 10.0 |
| 🇱🇦 Laos | 6.6 | 13.5 | 24.1 | 8.4 | 0.5 |
| 🇱🇻 Latvia | 26.2 | 38.4 | 25.0 | 5.3 | 0.8 |
| 🇱🇧 Lebanon | 18.6 | 0.6 | 8.7 | 9.2 | 1.1 |
| 🇱🇸 Lesotho | 2.1 | 3.8 | 3.0 | 2.0 | 3.9 |
| 🇱🇷 Liberia | 11.3 | 5.3 | 4.3 | 0.4 | 2.1 |
| 🇱🇾 Libya | 32.8 | 0.0 | 14.3 | 2.9 | 6.5 |
| 🇱🇹 Lithuania | 33.3 | 50.7 | 33.1 | 5.9 | 1.1 |
| 🇱🇺 Luxembourg | 18.1 | 33.1 | 31.7 | 25.7 | 2.0 |
| 🇲🇴 Macao | 45.6 | 46.9 | 73.2 | 9.4 | 1.8 |
| 🇲🇬 Madagascar | 3.1 | 1.0 | 4.0 | 1.3 | 0.5 |
| 🇲🇼 Malawi | 5.7 | 11.8 | 10.1 | 2.9 | 3.1 |
| 🇲🇾 Malaysia | 50.2 | 7.4 | 54.7 | 6.0 | 1.0 |
| 🇲🇻 Maldives | 11.0 | 0.4 | 83.1 | 5.9 | 0.8 |
| 🇲🇱 Mali | 2.4 | 0.1 | 8.5 | 3.6 | 2.6 |
| 🇲🇹 Malta | 25.2 | 25.8 | 22.8 | 26.4 | 1.8 |
| 🇲🇷 Mauritania | 6.3 | 0.0 | 8.4 | 6.4 | 18.4 |
| 🇲🇺 Mauritius | 38.7 | 3.2 | 24.0 | 4.5 | 4.2 |
| 🇲🇽 Mexico | 35.9 | 19.1 | 13.6 | 14.6 | 1.5 |
| 🇫🇲 Micronesia | 38.2 | 16.2 | 47.4 | 4.9 | 0.2 |
| 🇲🇩 Moldova | 17.2 | 19.2 | 11.7 | 1.9 | 0.3 |
| 🇲🇳 Mongolia | 3.0 | 0.6 | 0.6 | 26.6 | 81.4 |
| 🇲🇪 Montenegro | 17.1 | 43.2 | 15.6 | 15.0 | 2.1 |
| 🇲🇦 Morocco | 24.0 | 0.0 | 18.4 | 7.7 | 6.9 |
| 🇲🇿 Mozambique | 3.8 | 3.1 | 13.4 | 0.6 | 0.1 |
| 🇲🇲 Myanmar | 29.9 | 20.1 | 45.0 | 9.3 | 1.7 |
| 🇳🇦 Namibia | 10.2 | 4.5 | 11.9 | 8.8 | 8.9 |
| 🇳🇷 Nauru | 51.0 | 28.2 | 51.0 | 19.1 | 6.9 |
| 🇳🇵 Nepal | 2.3 | 1.0 | 3.5 | 8.2 | 2.7 |
| 🇳🇱 Netherlands | 10.0 | 27.7 | 21.9 | 16.2 | 5.2 |
| 🇳🇨 New Caledonia | 40.9 | 17.4 | 23.4 | 17.7 | 2.3 |
| 🇳🇿 New Zealand | 26.0 | 25.2 | 26.4 | 18.6 | 15.3 |
| 🇳🇮 Nicaragua | 21.8 | 5.3 | 6.6 | 2.2 | 0.4 |
| 🇳🇪 Niger | 1.0 | 0.1 | 1.8 | 2.8 | 4.4 |
| 🇳🇬 Nigeria | 1.2 | 1.5 | 6.7 | 1.6 | 2.8 |
| 🇰🇵 North Korea | 1.8 | 4.3 | 11.0 | 0.8 | 6.7 |
| 🇲🇰 North Macedonia | 20.0 | 12.6 | 6.2 | 6.8 | 0.9 |
| 🇳🇴 Norway | 20.0 | 23.7 | 50.2 | 17.8 | 5.8 |
| 🇴🇲 Oman | 19.7 | 0.4 | 26.1 | 9.0 | 14.3 |
| 🇵🇰 Pakistan | 6.2 | 0.0 | 1.6 | 9.8 | 2.6 |
| 🇵🇦 Panama | 55.4 | 15.9 | 13.7 | 14.5 | 1.0 |
| 🇵🇬 Papua New Guinea | 3.9 | 9.9 | 14.6 | 0.8 | 47.8 |
| 🇵🇾 Paraguay | 9.6 | 8.8 | 4.0 | 21.9 | 0.6 |
| 🇵🇪 Peru | 42.7 | 4.5 | 27.1 | 4.2 | 1.9 |
| 🇵🇭 Philippines | 15.9 | 14.5 | 29.1 | 3.1 | 0.3 |
| 🇵🇱 Poland | 32.9 | 55.0 | 12.5 | 1.5 | 0.1 |
| 🇵🇹 Portugal | 30.6 | 38.1 | 60.0 | 18.8 | 2.8 |
| 🇶🇦 Qatar | 54.3 | 1.2 | 21.1 | 8.4 | 12.1 |
| 🇷🇴 Romania | 23.9 | 34.5 | 8.3 | 5.2 | 2.7 |
| 🇷🇺 Russia | 30.8 | 28.2 | 21.7 | 12.9 | 5.1 |
| 🇷🇼 Rwanda | 1.5 | 1.0 | 4.6 | 2.7 | 3.2 |
| 🇰🇳 Saint Kitts & Nevis | 48.7 | 15.5 | 38.8 | 2.9 | 2.5 |
| 🇱🇨 Saint Lucia | 57.6 | 14.9 | 33.6 | 3.8 | 2.0 |
| 🇻🇨 Saint Vincent & the Grenadines | 74.7 | 11.3 | 19.4 | 7.8 | 0.7 |
| 🇼🇸 Samoa | 65.7 | 12.3 | 47.6 | 6.9 | 3.5 |
| 🇸🇹 Sao Tome & Principe | 17.1 | 4.7 | 27.7 | 1.7 | 0.1 |
| 🇸🇦 Saudi Arabia | 43.0 | 0.0 | 11.7 | 4.4 | 7.7 |
| 🇸🇳 Senegal | 7.4 | 1.2 | 11.9 | 5.0 | 3.7 |
| 🇷🇸 Serbia | 14.1 | 37.3 | 6.7 | 6.1 | 4.1 |
| 🇸🇨 Seychelles | 36.9 | 13.7 | 56.8 | 9.2 | 2.7 |
| 🇸🇱 Sierra Leone | 5.4 | 1.0 | 25.5 | 1.3 | 1.9 |
| 🇸🇰 Slovakia | 16.9 | 38.8 | 10.2 | 5.8 | 0.9 |
| 🇸🇮 Slovenia | 30.4 | 25.8 | 13.2 | 15.3 | 1.1 |
| 🇸🇧 Solomon Islands | 6.1 | 4.4 | 28.1 | 1.8 | 0.1 |
| 🇿🇦 South Africa | 34.9 | 4.2 | 6.5 | 17.2 | 3.5 |
| 🇰🇷 South Korea | 22.8 | 38.4 | 55.3 | 16.9 | 0.5 |
| 🇸🇸 South Sudan | 4.3 | 0.0 | 2.9 | 12.4 | 4.3 |
| 🇪🇸 Spain | 33.6 | 52.6 | 40.8 | 12.3 | 3.4 |
| 🇱🇰 Sri Lanka | 10.4 | 0.1 | 29.0 | 1.2 | 0.1 |
| 🇸🇩 Sudan | 1.9 | 0.0 | 1.1 | 8.0 | 10.5 |
| 🇸🇷 Suriname | 49.6 | 8.0 | 16.5 | 4.4 | 0.3 |
| 🇸🇪 Sweden | 15.4 | 28.6 | 32.2 | 22.5 | 1.5 |
| 🇨🇭 Switzerland | 16.9 | 27.8 | 16.0 | 19.1 | 2.4 |
| 🇸🇾 Syria | 6.4 | 0.0 | 2.2 | 2.2 | 7.3 |
| 🇹🇼 Taiwan | 41.6 | 38.4 | 29.8 | 6.1 | 0.9 |
| 🇹🇯 Tajikistan | 3.5 | 0.1 | 0.7 | 25.8 | 7.8 |
| 🇹🇿 Tanzania | 1.5 | 0.3 | 6.4 | 7.8 | 1.6 |
| 🇹🇭 Thailand | 11.4 | 13.1 | 29.2 | 1.2 | 0.0 |
| 🇹🇱 Timor-Leste | 9.4 | 11.5 | 6.4 | 1.6 | 0.4 |
| 🇹🇬 Togo | 7.2 | 2.3 | 11.7 | 0.8 | 2.2 |
| 🇹🇹 Trinidad & Tobago | 63.1 | 5.6 | 23.6 | 5.7 | 1.5 |
| 🇹🇳 Tunisia | 17.9 | 0.0 | 14.1 | 3.7 | 5.8 |
| 🇹🇷 Türkiye | 20.0 | 0.0 | 5.5 | 16.0 | 1.3 |
| 🇹🇲 Turkmenistan | 6.1 | 0.1 | 2.8 | 22.5 | 20.8 |
| 🇺🇸 U.S. | 58.7 | 30.6 | 22.8 | 37.9 | 1.4 |
| 🇦🇪 UAE | 31.1 | 0.0 | 25.4 | 6.7 | 10.4 |
| 🇺🇬 Uganda | 1.5 | 2.9 | 14.3 | 3.6 | 1.0 |
| 🇬🇧 UK | 32.7 | 24.0 | 17.9 | 17.4 | 5.0 |
| 🇺🇦 Ukraine | 24.9 | 16.7 | 13.8 | 7.2 | 0.7 |
| 🇺🇾 Uruguay | 21.0 | 14.1 | 9.1 | 19.4 | 3.5 |
| 🇺🇿 Uzbekistan | 3.1 | 0.2 | 4.0 | 31.6 | 6.1 |
| 🇻🇺 Vanuatu | 14.6 | 12.4 | 29.0 | 7.2 | 0.3 |
| 🇻🇪 Venezuela | 16.1 | 4.4 | 10.2 | 12.0 | 0.3 |
| 🇻🇳 Vietnam | 15.8 | 38.2 | 39.6 | 6.1 | 0.5 |
| 🇾🇪 Yemen | 11.2 | 0.0 | 3.0 | 3.0 | 4.5 |
| 🇿🇲 Zambia | 2.6 | 1.5 | 13.1 | 9.3 | 2.7 |
| 🇿🇼 Zimbabwe | 4.6 | 0.7 | 3.0 | 42.3 | 4.3 |
The world’s largest consumers of meat per capita? Hong Kong, Iceland, and Macao have the highest total meat consumption, all above 170 kg (370 lbs) per capita.
We take a brief look through the biggest consumers of each type of meat below.
Who Eats the Most Poultry?
While the U.S. and China eat the most chicken by absolute numbers, the countries rank 7th and 112th respectively when it comes to poultry consumption on a per capita basis.
Several island nations—St. Vincent and the Grenadines, Trinidad & Tobago, Samoa—along with Israel eat more than 60 kilograms of poultry meat (about 15 large birds) per person on an annual basis.
Regionally, poultry consumption can be seen spanning almost all of the Americas, as well as in the UK and former British colonies Australia and South Africa, and in the Middle East.
Who Eats the Most Pork?
Despite eating more seafood and poultry, Hong Kong leads the world in pork consumption per capita annually at 55 kg (121 lbs). This is almost equivalent to the average amount of retail pork harvested from a single 250 lb pig.
Poland and Spain—who are also top pork producers—rank close behind Hong Kong with similar pork consumption numbers. Indeed, we can see pork as the most consumed meat in many European countries with local histories of pork foods, as well as in a few countries in Africa including Burkina Faso and one Southeast Asian country, Timor-Leste.
Who Eats the Most Fish and Seafood?
In the middle of the North Atlantic ocean, Iceland eats the most fish and seafood in the world, at a staggering 90 kg (nearly 200 lbs), per person per year. That also gives Iceland the crown for the highest per-capita consumption of any single type of meat.
Behind Iceland are other island and high coastline nations, including the Maldives, Hong Kong, Macao, and Portugal. Regionally we can see the importance of seafood reflected in East and South Asia, the Atlantic coastline of Africa, and the Nordic countries in Europe.
Who Eats the Most Beef?
Argentina’s 46-million-strong population eats nearly 47 kg (103 lbs) of bovine meat per person per year, the most by any country in the UN’s database.
The South American country has a rich culinary history with beef, as cattle brought by Spanish settlers flourished on the grassy plains of the region. Such is cattle’s importance on the continent that the gaucho—a horseman engaged in cattle work—is a folk symbol in Argentina, Uruguay and parts of Brazil (which ranks 5th in beef consumption).
The map of beef consumption highlights Central Asian countries including Uzbekistan and Eastern African countries including Ethiopia.
Who Eats the Most Mutton & Other Meat?
The people of Mongolia are unrivaled in their consumption of mutton and goat meat, devouring an impressive 66 kilograms (145 pounds) per capita annually. This voracious appetite for meat is deeply rooted in their heritage as a nation of skilled shepherds.
Papua New Guinea, meanwhile, tops the “other meat” consumption rankings. The country is the largest producer of game meat in the world, due to its mostly rural and indigenous population relying on hunting. One 2023 study found that a sample of villages in the country primarily hunted wild deer and boar for meat, although marsupials like bandicoots, tree-kangaroos, and cuscus were occasionally hunted and consumed as well.
Mongolia also ranks highly in consumption of other meat per capita, likely due to their traditional consumption of horse meat. The country produced just over 100,000 tons of horse meat in 2020, one-sixth of the country’s total meat production that year.
Mapping Meat Consumption By Country, Without Seafood
What happens to each country’s meat consumption habits if we remove fish and seafood from the dataset? The map, and the rankings change quite a bit.
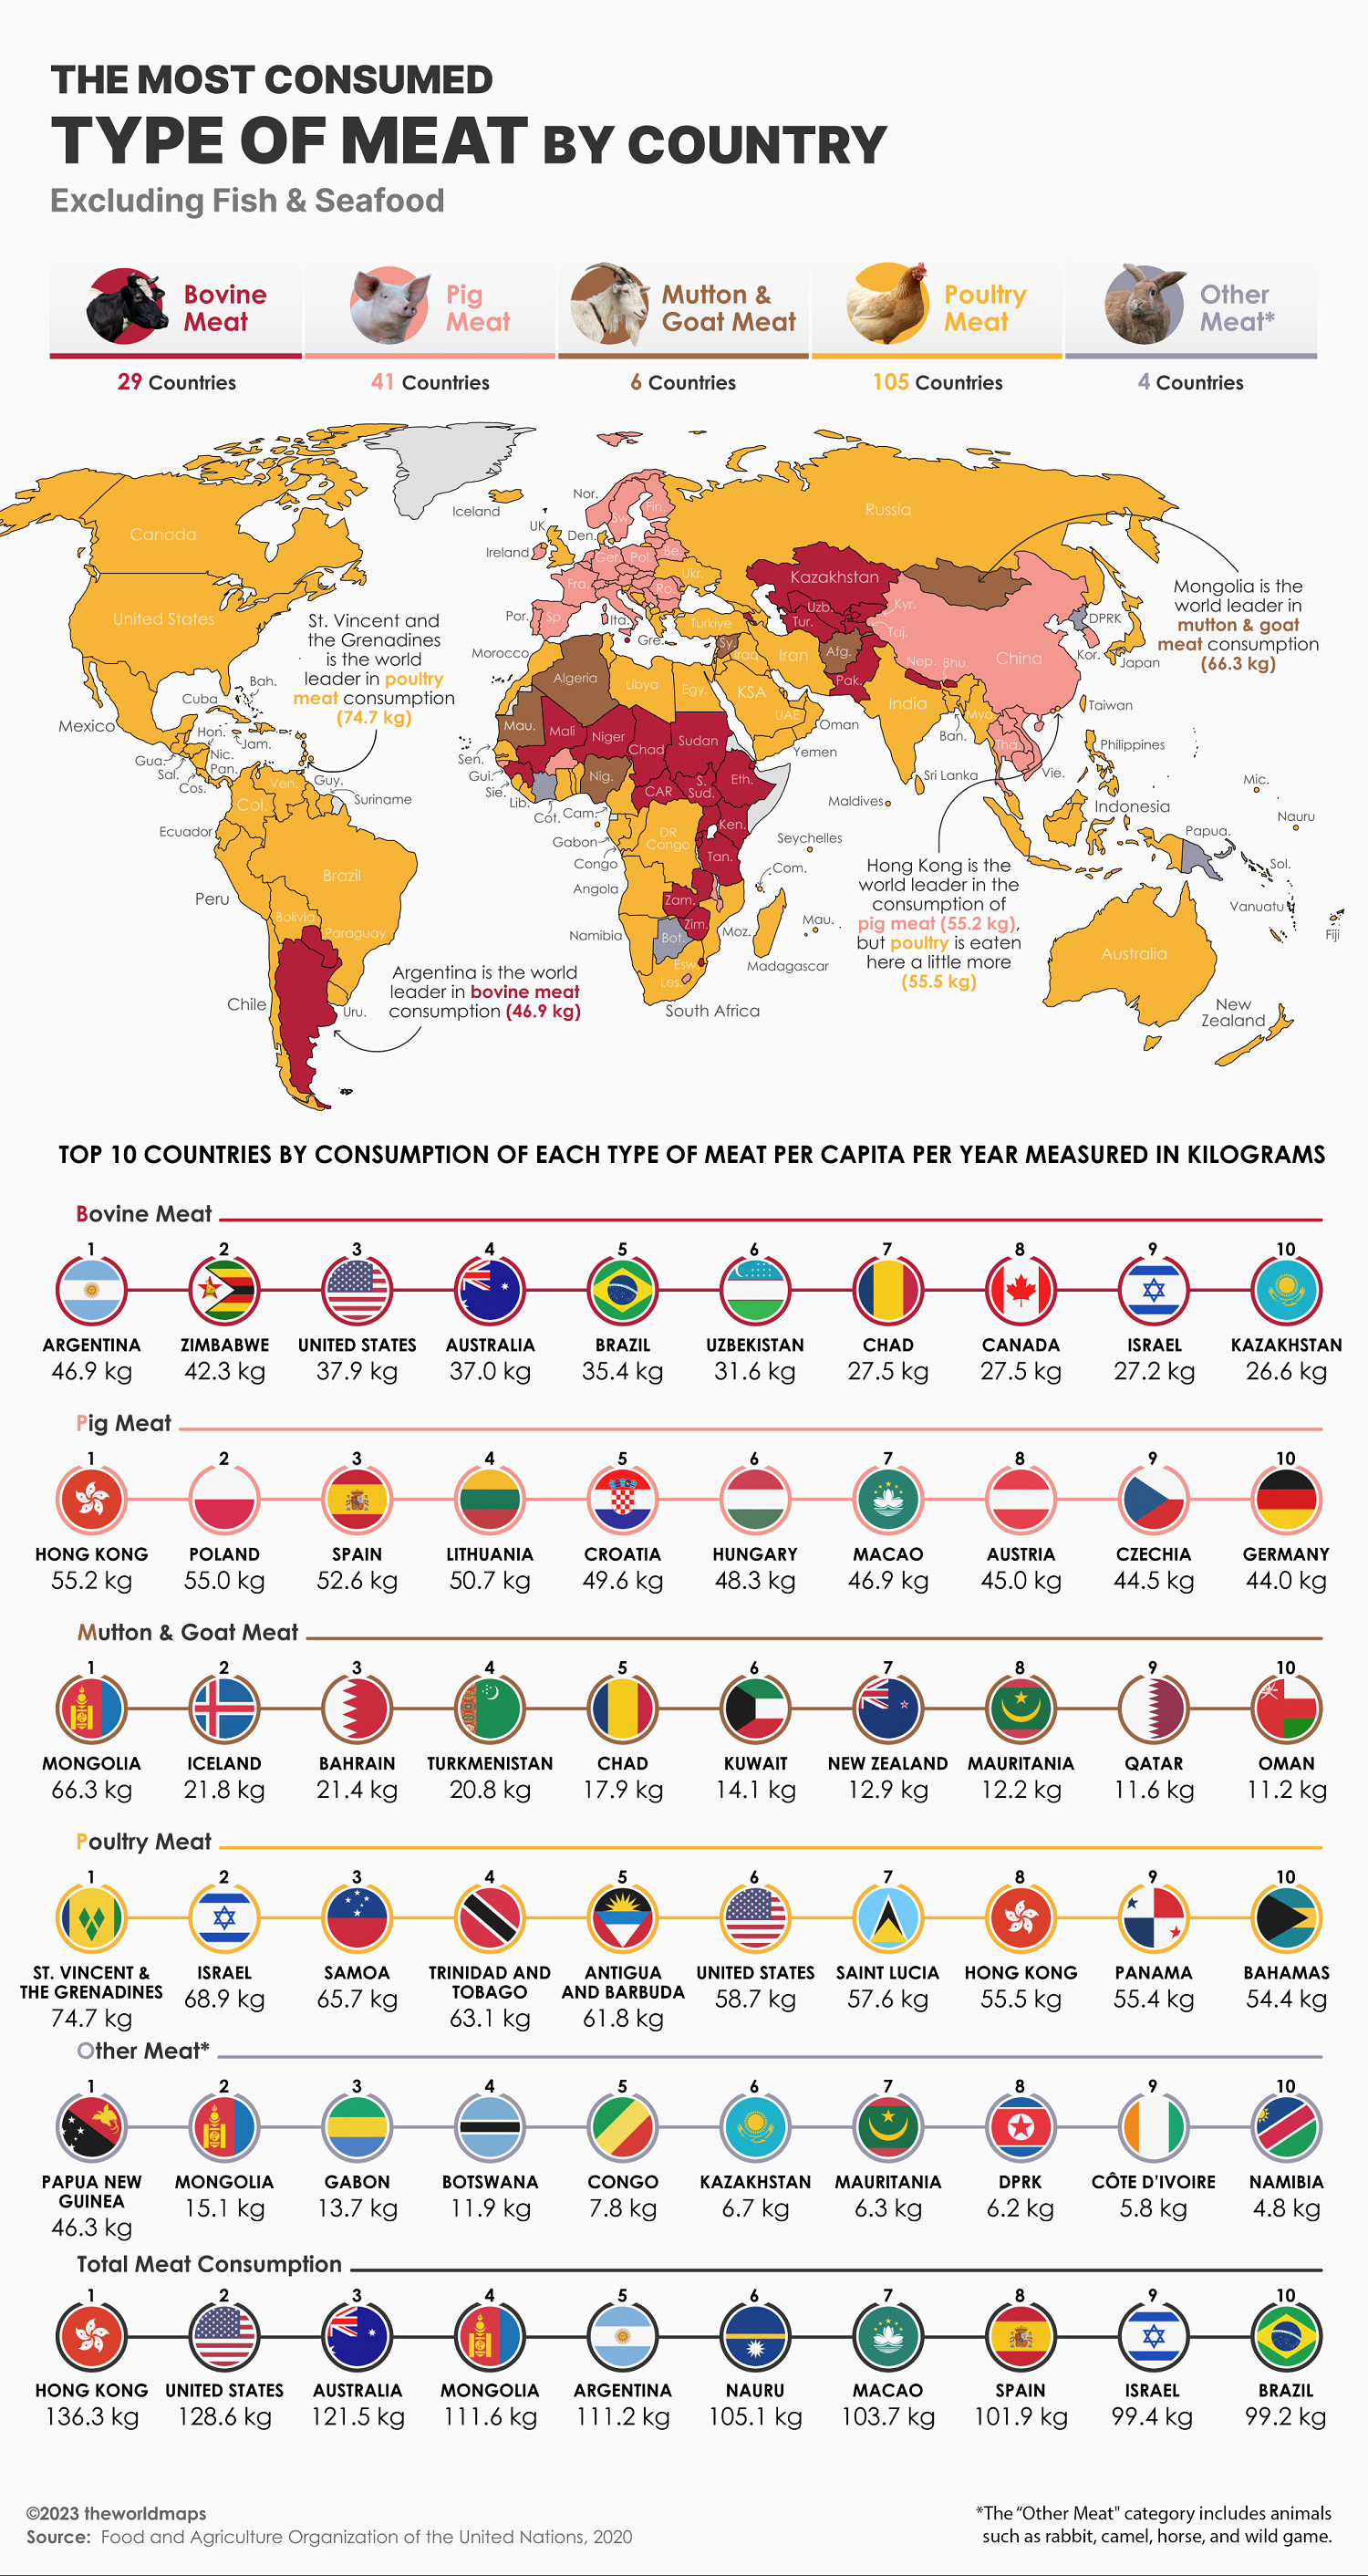
Most of the blue on the map is replaced with a wash of yellow, indicating the global popularity of poultry meat as a cheap and efficient source of protein. However, much of East Asia including China and European countries like France and Sweden consume more pork.
The rankings for total meat consumption also shuffle.
| Country | Total (With Seafood) | Total (Without Seafood) |
|---|---|---|
| 🇦🇫 Afghanistan | 9.6 | 9.3 |
| 🇦🇱 Albania | 47.8 | 39.1 |
| 🇩🇿 Algeria | 22.4 | 18.6 |
| 🇦🇴 Angola | 34.1 | 19.9 |
| 🇦🇬 Antigua & Barbuda | 136.2 | 82.1 |
| 🇦🇷 Argentina | 116.9 | 110.2 |
| 🇦🇲 Armenia | 56.4 | 50.9 |
| 🇦🇺 Australia | 145.6 | 121.5 |
| 🇦🇹 Austria | 91.2 | 76.9 |
| 🇦🇿 Azerbaijan | 38.9 | 36.9 |
| 🇧🇸 Bahamas | 109.3 | 85.1 |
| 🇧🇭 Bahrain | 96.9 | 80.6 |
| 🇧🇩 Bangladesh | 31.1 | 4.3 |
| 🇧🇧 Barbados | 115.8 | 73.0 |
| 🇧🇾 Belarus | 102.2 | 90.4 |
| 🇧🇪 Belgium | 84.5 | 61.9 |
| 🇧🇿 Belize | 61.8 | 48.5 |
| 🇧🇯 Benin | 30.8 | 14.6 |
| 🇧🇹 Bhutan | 23.4 | 16.1 |
| 🇧🇴 Bolivia | 79.9 | 77.1 |
| 🇧🇦 Bosnia & Herzegovina | 50.1 | 42.8 |
| 🇧🇼 Botswana | 31.1 | 28.6 |
| 🇧🇷 Brazil | 107.2 | 99.2 |
| 🇧🇬 Bulgaria | 64.3 | 56.9 |
| 🇧🇫 Burkina Faso | 43.2 | 34.3 |
| 🇧🇮 Burundi | 5.7 | 3.1 |
| 🇨🇻 Cabo Verde | 41.2 | 30.4 |
| 🇰🇭 Cambodia | 58.6 | 12.9 |
| 🇨🇲 Cameroon | 30.8 | 11.6 |
| 🇨🇦 Canada | 111.3 | 90.6 |
| 🇨🇫 Central African Republic | 45.1 | 37.8 |
| 🇹🇩 Chad | 53.5 | 46.9 |
| 🇨🇱 Chile | 97.8 | 83.0 |
| 🇨🇳 China | 102.0 | 62.1 |
| 🇨🇴 Colombia | 67.0 | 58.1 |
| 🇰🇲 Comoros | 45.5 | 31.2 |
| 🇨🇬 Congo | 64.5 | 40.0 |
| 🇨🇷 Costa Rica | 76.4 | 58.5 |
| 🇨🇮 Côte d’Ivoire | 35.0 | 11.8 |
| 🇭🇷 Croatia | 98.6 | 79.5 |
| 🇨🇺 Cuba | 77.6 | 71.6 |
| 🇨🇾 Cyprus | 101.1 | 75.6 |
| 🇨🇿 Czechia | 89.6 | 79.2 |
| 🇩🇰 Denmark | 90.1 | 63.7 |
| 🇩🇯 Djibouti | 18.9 | 15.4 |
| 🇩🇲 Dominica | 87.9 | 60.1 |
| 🇩🇴 Dominican Republic | 57.1 | 48.6 |
| 🇨🇩 DR Congo | 7.4 | 3.3 |
| 🇪🇨 Ecuador | 53.6 | 45.4 |
| 🇪🇬 Egypt | 50.3 | 23.3 |
| 🇸🇻 El Salvador | 45.4 | 38.8 |
| 🇪🇪 Estonia | 82.4 | 67.8 |
| 🇸🇿 Eswatini | 31.7 | 27.4 |
| 🇪🇹 Ethiopia | 8.4 | 7.9 |
| 🇫🇯 Fiji | 67.4 | 40.9 |
| 🇫🇮 Finland | 104.8 | 71.4 |
| 🇫🇷 France | 111.5 | 78.2 |
| 🇵🇫 French Polynesia | 135.4 | 88.2 |
| 🇬🇦 Gabon | 95.7 | 67.0 |
| 🇬🇲 Gambia | 40.6 | 15.5 |
| 🇬🇪 Georgia | 45.1 | 35.1 |
| 🇩🇪 Germany | 91.4 | 78.8 |
| 🇬🇭 Ghana | 43.5 | 18.5 |
| 🇬🇷 Greece | 96.2 | 74.5 |
| 🇬🇩 Grenada | 91.3 | 57.5 |
| 🇬🇹 Guatemala | 47.2 | 44.2 |
| 🇬🇳 Guinea | 23.6 | 13.9 |
| 🇬🇼 Guinea-Bissau | 16.5 | 15.3 |
| 🇬🇾 Guyana | 76.8 | 51.8 |
| 🇭🇹 Haiti | 25.0 | 20.0 |
| 🇭🇳 Honduras | 35.4 | 32.8 |
| 🇭🇰 Hong Kong | 202.1 | 136.3 |
| 🇭🇺 Hungary | 89.3 | 82.9 |
| 🇮🇸 Iceland | 180.9 | 90.2 |
| 🇮🇳 India | 12.6 | 4.6 |
| 🇮🇩 Indonesia | 62.3 | 17.9 |
| 🇮🇷 Iran | 50.6 | 38.0 |
| 🇮🇶 Iraq | 13.8 | 10.2 |
| 🇮🇪 Ireland | 101.8 | 79.2 |
| 🇮🇱 Israel | 124.1 | 99.4 |
| 🇮🇹 Italy | 99.4 | 70.2 |
| 🇯🇲 Jamaica | 86.7 | 61.5 |
| 🇯🇵 Japan | 99.6 | 53.4 |
| 🇯🇴 Jordan | 42.8 | 37.7 |
| 🇰🇿 Kazakhstan | 74.7 | 71.9 |
| 🇰🇪 Kenya | 13.6 | 10.7 |
| 🇰🇮 Kiribati | 112.4 | 39.2 |
| 🇰🇼 Kuwait | 86.6 | 72.7 |
| 🇰🇬 Kyrgyzstan | 33.2 | 32.1 |
| 🇱🇦 Laos | 53.1 | 29.0 |
| 🇱🇻 Latvia | 95.8 | 70.8 |
| 🇱🇧 Lebanon | 38.2 | 29.5 |
| 🇱🇸 Lesotho | 14.7 | 11.7 |
| 🇱🇷 Liberia | 23.4 | 19.1 |
| 🇱🇾 Libya | 56.5 | 42.2 |
| 🇱🇹 Lithuania | 123.9 | 90.9 |
| 🇱🇺 Luxembourg | 110.6 | 78.9 |
| 🇲🇴 Macao | 176.9 | 103.7 |
| 🇲🇬 Madagascar | 9.8 | 5.8 |
| 🇲🇼 Malawi | 33.7 | 23.6 |
| 🇲🇾 Malaysia | 119.4 | 64.7 |
| 🇲🇻 Maldives | 101.2 | 18.1 |
| 🇲🇱 Mali | 17.1 | 8.6 |
| 🇲🇹 Malta | 102.0 | 79.1 |
| 🇲🇷 Mauritania | 39.5 | 31.1 |
| 🇲🇺 Mauritius | 74.5 | 50.5 |
| 🇲🇽 Mexico | 84.7 | 71.1 |
| 🇫🇲 Micronesia | 106.7 | 59.4 |
| 🇲🇩 Moldova | 50.3 | 38.6 |
| 🇲🇳 Mongolia | 112.1 | 111.6 |
| 🇲🇪 Montenegro | 93.0 | 77.4 |
| 🇲🇦 Morocco | 57.0 | 38.6 |
| 🇲🇿 Mozambique | 21.0 | 7.6 |
| 🇲🇲 Myanmar | 106.0 | 61.0 |
| 🇳🇦 Namibia | 44.3 | 32.4 |
| 🇳🇷 Nauru | 156.2 | 105.1 |
| 🇳🇵 Nepal | 17.7 | 14.2 |
| 🇳🇱 Netherlands | 81.0 | 59.1 |
| 🇳🇨 New Caledonia | 101.7 | 78.3 |
| 🇳🇿 New Zealand | 111.4 | 85.0 |
| 🇳🇮 Nicaragua | 36.3 | 29.6 |
| 🇳🇪 Niger | 10.1 | 8.3 |
| 🇳🇬 Nigeria | 13.8 | 7.0 |
| 🇰🇵 North Korea | 24.6 | 13.6 |
| 🇲🇰 North Macedonia | 46.6 | 40.3 |
| 🇳🇴 Norway | 117.4 | 67.2 |
| 🇴🇲 Oman | 69.5 | 43.4 |
| 🇵🇰 Pakistan | 20.2 | 18.6 |
| 🇵🇦 Panama | 100.5 | 86.8 |
| 🇵🇬 Papua New Guinea | 77.0 | 62.4 |
| 🇵🇾 Paraguay | 44.9 | 40.9 |
| 🇵🇪 Peru | 80.5 | 53.4 |
| 🇵🇭 Philippines | 62.8 | 33.7 |
| 🇵🇱 Poland | 102.0 | 89.5 |
| 🇵🇹 Portugal | 150.2 | 90.2 |
| 🇶🇦 Qatar | 96.9 | 75.9 |
| 🇷🇴 Romania | 74.7 | 66.4 |
| 🇷🇺 Russia | 98.6 | 76.9 |
| 🇷🇼 Rwanda | 12.9 | 8.4 |
| 🇰🇳 Saint Kitts & Nevis | 108.5 | 69.7 |
| 🇱🇨 Saint Lucia | 111.9 | 78.3 |
| 🇻🇨 Saint Vincent & the Grenadines | 113.8 | 94.4 |
| 🇼🇸 Samoa | 135.9 | 88.3 |
| 🇸🇹 Sao Tome & Principe | 51.3 | 23.6 |
| 🇸🇦 Saudi Arabia | 66.8 | 55.0 |
| 🇸🇳 Senegal | 29.1 | 17.2 |
| 🇷🇸 Serbia | 68.3 | 61.6 |
| 🇸🇨 Seychelles | 119.2 | 62.5 |
| 🇸🇱 Sierra Leone | 35.0 | 9.5 |
| 🇸🇰 Slovakia | 72.7 | 62.5 |
| 🇸🇮 Slovenia | 85.7 | 72.5 |
| 🇸🇧 Solomon Islands | 40.5 | 12.4 |
| 🇿🇦 South Africa | 66.2 | 59.8 |
| 🇰🇷 South Korea | 133.8 | 78.5 |
| 🇸🇸 South Sudan | 23.9 | 21.0 |
| 🇪🇸 Spain | 142.7 | 101.9 |
| 🇱🇰 Sri Lanka | 40.8 | 11.8 |
| 🇸🇩 Sudan | 21.5 | 20.3 |
| 🇸🇷 Suriname | 78.8 | 62.3 |
| 🇸🇪 Sweden | 100.2 | 68.0 |
| 🇨🇭 Switzerland | 82.2 | 66.2 |
| 🇸🇾 Syria | 18.0 | 15.8 |
| 🇹🇼 Taiwan | 116.7 | 87.0 |
| 🇹🇯 Tajikistan | 37.9 | 37.2 |
| 🇹🇿 Tanzania | 17.6 | 11.2 |
| 🇹🇭 Thailand | 54.9 | 25.8 |
| 🇹🇱 Timor-Leste | 29.3 | 22.9 |
| 🇹🇬 Togo | 24.2 | 12.5 |
| 🇹🇹 Trinidad & Tobago | 99.5 | 75.9 |
| 🇹🇳 Tunisia | 41.4 | 27.3 |
| 🇹🇷 Türkiye | 42.8 | 37.3 |
| 🇹🇲 Turkmenistan | 52.2 | 49.4 |
| 🇺🇸 U.S. | 151.4 | 128.6 |
| 🇦🇪 UAE | 73.6 | 48.2 |
| 🇺🇬 Uganda | 23.3 | 9.0 |
| 🇬🇧 UK | 97.0 | 79.1 |
| 🇺🇦 Ukraine | 63.3 | 49.5 |
| 🇺🇾 Uruguay | 67.3 | 58.1 |
| 🇺🇿 Uzbekistan | 45.0 | 41.0 |
| 🇻🇺 Vanuatu | 63.5 | 34.5 |
| 🇻🇪 Venezuela | 43.1 | 32.9 |
| 🇻🇳 Vietnam | 100.2 | 60.6 |
| 🇾🇪 Yemen | 21.7 | 18.7 |
| 🇿🇲 Zambia | 29.3 | 16.2 |
| 🇿🇼 Zimbabwe | 54.9 | 51.9 |
Hong Kong remains at the top, but the U.S. jumps up three spots to second place, with annual per capita meat consumption at 128 kg (282 lbs) when seafood isn’t included.
Iceland and Macao drop to the top 15, while Australia, Mongolia, and Argentina climb into the top five. Other countries that preferred seafood dropped a lot lower, such as Japan, which fell 40 spots in the total consumption rankings when fish was removed.

This article was published as a part of Visual Capitalist's Creator Program, which features data-driven visuals from some of our favorite Creators around the world.


Agriculture
Ranked: The World’s Top Cotton Producers
As the most-used natural fiber, cotton has become the most important non-food agricultural product.

Ranked: The World’s Top Cotton Producers
This was originally posted on Elements. Sign up to the free mailing list to get beautiful visualizations on natural resource megatrends in your email every week.
Cotton is present in our everyday life, from clothes to coffee strainers, and more recently in masks to control the spread of COVID-19.
As the most-used natural fiber, cotton has become the most important non-food agricultural product. Currently, approximately half of all textiles require cotton fibers.
The above infographic lists the world’s top cotton producers, using data from the United States Department of Agriculture.
Fancy Fabric
Originating from the Arabic word “quton,” meaning fancy fabric, cotton is a staple fiber made up of short fibers twisted together to form yarn.
The earliest production of cotton was around 5,000 B.C. in India, and today, around 25 million tons of cotton are produced each year.
Currently, five countries make up around 75% of global cotton production, with China being the world’s biggest producer. The country is responsible for over 23% of global production, with approximately 89 million cotton farmers and part-time workers. Cotton’s importance cannot be understated, as it is the primary input for the Chinese textile industry along with many other nations’ textile industries.
| Top Cotton Producers | 2020/2021 (metric tons) | 2021/2022 (metric tons) |
|---|---|---|
| 🇨🇳 China | 6,445,000 | 5,835,000 |
| 🇮🇳 India | 6,009,000 | 5,334,000 |
| 🇺🇸 United States | 3,181,000 | 3,815,000 |
| 🇧🇷 Brazil | 2,356,000 | 2,504,000 |
| 🇦🇺 Australia | 610,000 | 1,252,000 |
| 🇵🇰 Pakistan | 980,000 | 1,306,000 |
| 🇹🇷 Turkey | 631,000 | 827,000 |
| 🌐 Other | 4,059,000 | 4,282,000 |
| Total | 24,271,000 | 25,155,000 |
The United States is the leading global exporter of cotton, exporting three-fourths of its crop with China as the top buyer.
Despite its importance for the global economy, cotton production faces significant sustainability challenges.
The Controversy Over Cotton
Cotton is one of the largest users of water among all agricultural commodities, and production often involves applying pesticides that threaten soil and water quality.
Along with this, production often involves forced and child labor. According to the European Commission, child labor in the cotton supply chain is most common in Africa and Asia, where it comes from small-holder farmers.
In 2020, U.S. apparel maker Patagonia stopped sourcing cotton from the autonomous territory of Xinjiang because of reports about forced labor and other human rights abuses against Uighurs and other ethnic minorities.
L Brands, the parent company of Victoria’s Secret, has also committed to eliminating Chinese cotton from its supply chain. Whether these changes in supply chains impact China’s cotton production and its practices, cotton remains essential to materials found across our daily lives.

-
 Environment5 days ago
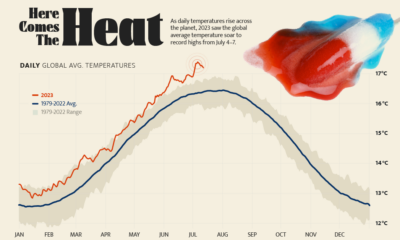
Hotter Than Ever: 2023 Sets New Global Temperature Records
-

 Datastream4 weeks ago
Can You Calculate Your Daily Carbon Footprint?
-
 Energy2 weeks ago
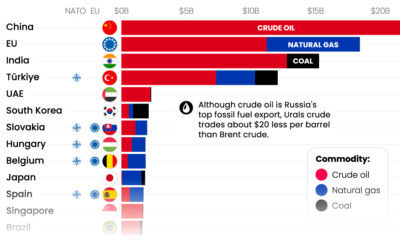
Who’s Still Buying Russian Fossil Fuels in 2023?
-

 VC+4 days ago
What’s New on VC+ in July
-

 Investor Education4 weeks ago
Visualizing BlackRock’s Top Equity Holdings
-

 apps2 weeks ago
Meet the Competing Apps Battling for Twitter’s Market Share
-
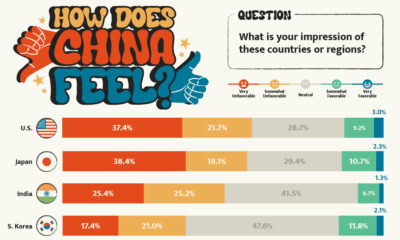
 Politics14 hours ago
How Do Chinese Citizens Feel About Other Countries?
-

 Markets4 weeks ago
Visualizing Every Company on the S&P 500 Index