Automotive
Interactive: Comparing Carmaker Revenue vs. Country GDP
Article/Editing:
Comparing Carmaker Revenue vs. Country GDP
As of July 2022, the global car and manufacturing market was worth about $2.9 trillion.
What companies are currently dominating this massive industry, and how much revenue do they generate on a yearly basis compared to the economic output of countries?
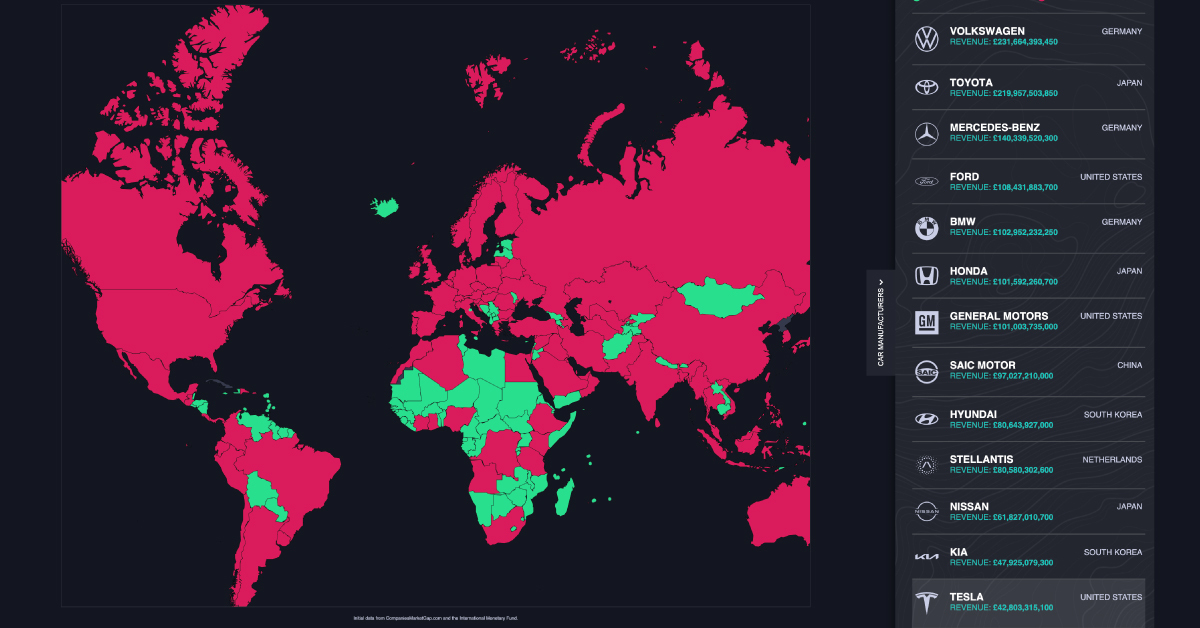
To help put things into perspective, this graphic by Vanarama looks at the revenue of the world’s top carmakers, and compares each company’s revenue to the gross domestic product (GDP) of 196 countries worldwide.
The World’s Largest Carmakers by Revenue
Based on data from CompaniesMarketCap.com, here’s a look at some of the biggest carmakers in the world, and how much revenue they brought in from Q1 2021 to Q1 2022:
| Rank | Carmaker | Revenue (Q1 2021 to Q1 2022) | Country of origin |
|---|---|---|---|
| 1 | Volkswagen | $291 billion | 🇩🇪 Germany |
| 2 | Toyota | $276 billion | 🇯🇵 Japan |
| 3 | Mercedes-Benz | $176 billion | 🇩🇪 Germany |
| 4 | Ford | $136 billion | 🇺🇸 United States |
| 5 | BMW | $129 billion | 🇩🇪 Germany |
| 6 | Honda | $127 billion | 🇯🇵 Japan |
| 7 | General Motors | $127 billion | 🇺🇸 United States |
| 8 | SAIC Motor | $122 billion | 🇨🇳 China |
| 9 | Hyundai | $101 billion | 🇰🇷 South Korea |
| 10 | Stellantis | $101 billion | 🇳🇱 Netherlands |
| 11 | Nissan | $77 billion | 🇯🇵 Japan |
| 12 | Kia | $60 billion | 🇰🇷 South Korea |
| 13 | Tesla | $53 billion | 🇺🇸 United States |
| 14 | Renault | $52 billion | 🇫🇷 France |
| 15 | BYD | $33 billion | 🇨🇳 China |
| 16 | Suzuki Motor | $31 billion | 🇯🇵 Japan |
| 17 | Volvo Car | $31 billion | 🇸🇪Sweden |
| 18 | Mazda | $27 billion | 🇯🇵 Japan |
| 19 | Subaru | $24 billion | 🇯🇵 Japan |
| 20 | Isuzu | $21 billion | 🇯🇵 Japan |
In first place was German car manufacturer Volkswagen, which generated about $291 billion in revenue between Q1 2022 and Q1 2022—that’s more spending power than 76% of the countries included in the dataset.
In 2021, Volkswagen’s best-selling vehicles were the Tiguan, a mid-size SUV, and the Polo, a compact hatchback. In addition to the Volkswagen brand, the company itself owns a handful of luxury car brands including Audi, Bentley, and Porsche.
Toyota came in second place, with a total of $276 billion in revenue from Q1 2021 to Q1 2022. While the Japanese manufacturer is popular in its country of origin, America is actually its largest market—in 2021, more than 2.3 million Toyota vehicles were sold in the United States, nearly double the amount sold in Japan.
How Important are These Brands to Their Countries’ GDPs?
As this graphic illustrates, these car manufacturers generate billions in revenue each year. Their financial power is so significant, they’ve become big parts of their home countries’ national economies.
But just how important are these brands to their countries of origin? Here’s a look at 20 different carmakers, as a percentage of their country of origin’s GDP:

One carmaker is nearly in the double digits—the revenue from Dutch automobile manufacturer Stellantis is equivalent to approximately 9.95% of the Netherland’s GDP.
Founded in 2021, Stellantis is comprised of 16 different international car brands, including well-known Europeans brands like Vauxhall and Citroen, as well as some American manufacturers like Dodge and Chrysler.
Other countries also have a large combined output from automakers, including Japan (11.91%) and Germany (13.97%).
But it’s important to note that each company’s revenue is not wholly contained in their home country’s GDP. Many major automakers have international subsidiaries for localized production, with revenue falling under those countries’ GDPs.

This article was published as a part of Visual Capitalist's Creator Program, which features data-driven visuals from some of our favorite Creators around the world.


Automotive
Global EV Production: BYD Surpasses Tesla
This graphic explores the latest EV production data for 2022, which shows BYD taking a massive step forward to surpass Tesla.

Global EV Production: BYD Surpasses Tesla
This was originally posted on Elements. Sign up to the free mailing list to get beautiful visualizations on natural resource megatrends in your email every week.
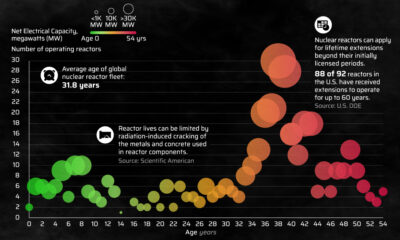
2022 was another historic year for EVs, with annual production surpassing 10 million cars for the first time ever. This represents a sizeable bump up from 2021’s figure of 6.7 million.
In this infographic, we’ve used data from EV Volumes to visualize the top 15 brands by output. The color of each brand’s bubble represents their growth from 2021, with the darker shades depicting a larger percentage increase.
Data Overview and Key Takeaways
The raw data we used to create this infographic is listed below. Volume figures for 2021 were included for convenience.
| Rank | Company | 2022 | 2021 | Growth from 2021 |
|---|---|---|---|---|
| 1 | 🇨🇳 BYD | 1,858,364 | 598,019 | 211% |
| 2 | 🇺🇸 Tesla | 1,314,319 | 936,247 | 40% |
| 3 | 🇩🇪 VW Group | 839,207 | 763,851 | 10% |
| 4 | 🇺🇸 GM (incl. Wuling Motors) | 584,602 | 516,631 | 13% |
| 5 | 🇺🇸 🇮🇹 🇫🇷 Stellantis | 512,276 | 381,843 | 34% |
| 6 | 🇰🇷 Hyundai Motors (incl. Kia) | 497,816 | 348,660 | 43% |
| 7 | 🇩🇪 BMW Group | 433,164 | 329,182 | 32% |
| 8 | 🇨🇳 Geely Auto Group | 351,356 | 99,980 | 251% |
| 9 | 🇩🇪 Mercedes-Benz Group | 337,364 | 281,929 | 20% |
| 10 | 🇫🇷 🇯🇵 Renault-Nissan-Mitsubishi Alliance | 335,964 | 289,473 | 16% |
| 11 | 🇨🇳 GAC Group | 287,977 | 125,384 | 130% |
| 12 | 🇨🇳 SAIC Motor Corp. | 256,341 | 237,043 | 8% |
| 13 | 🇸🇪 Volvo Cars | 253,266 | 220,576 | 15% |
| 14 | 🇨🇳 Chery Auto Co. | 253,141 | 107,482 | 136% |
| 15 | 🇨🇳 Changan Auto Co. | 245,555 | 105,072 | 134% |
| 16 | 🌎 Other (41 companies) | 1,927,211 | 1,326,262 | 45% |
Includes BEVs and PHEVs
BYD Auto
BYD Auto has leaped past Tesla to become the new EV king, boosting its output by a massive 211% in 2022. Given this trajectory, the company will likely become the world’s first automaker to produce over 2 million EVs in a single year.
BYD has a limited presence in non-domestic markets, but this could change rather quickly. The company is planning a major push into Europe, where it expects to build factories in order to avoid EU tariffs on Chinese car imports.
The company is also building a factory in Thailand, to produce right-hand drive models for markets like Australia, New Zealand, and the UK.
Tesla
Tesla increased its output by a respectable 40% in 2022, staying ahead of Western brands like Volkswagen (+10%) and GM (+13%), but falling behind its Chinese rivals such as Geely (+251%).
Whether these Chinese brands can maintain their triple digit growth figures is uncertain, but one thing is clear: Tesla is facing more competition than ever before.
The company is targeting annual production of 20 million cars by 2030, meaning it will need to keep yearly growth rates in the high double digits for the rest of the decade. To support this initiative, Tesla is planning a multi-billion dollar factory in Mexico capable of producing 1 million cars a year.
Hyundai
Hyundai Motor Company, which also owns Kia, posted a similar growth rate to Tesla. The South Korean automaker was a relatively early player in the EV space, revealing the first Hyundai Ioniq in 2016.
In late 2022, several countries including South Korea expressed their disapproval of the Biden administration’s Inflation Reduction Act, which withdrew tax credits on EVs not produced within the United States.
Hyundai is currently building a $5.5 billion EV factory in the state of Georgia, but this facility will not become operational until 2025. In the meantime, South Korea has revised its own EV subsidy program to favor domestic brands.

-
 Energy3 weeks ago
How Old Are the World’s Nuclear Reactors?
-
 Countries7 days ago
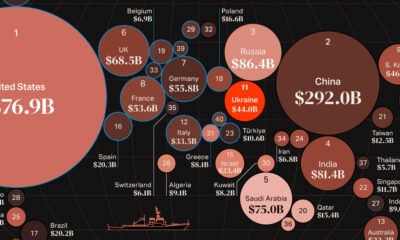
Mapped: World’s Top 40 Largest Military Budgets
-
 Energy3 weeks ago
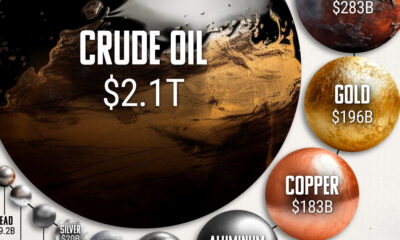
How Big is the Market for Crude Oil?
-

 United States6 days ago
Mapped: The Safest Cities in the U.S.
-
 Markets2 weeks ago
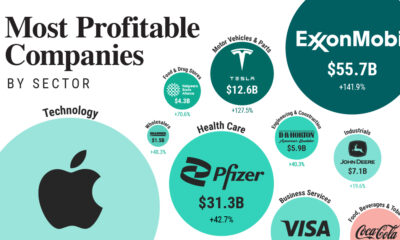
Ranked: The Most Profitable U.S. Companies, by Sector
-
 Technology5 days ago
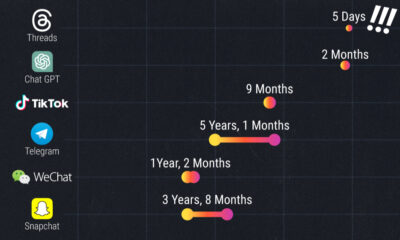
How Long it Took for Popular Apps to Reach 100 Million Users
-
 Markets4 weeks ago
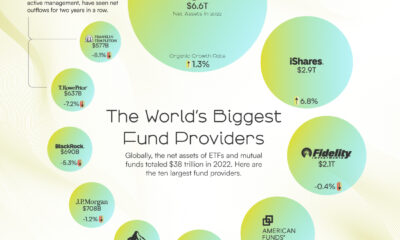
The World’s Biggest Mutual Fund and ETF Providers
-
 Brands2 weeks ago
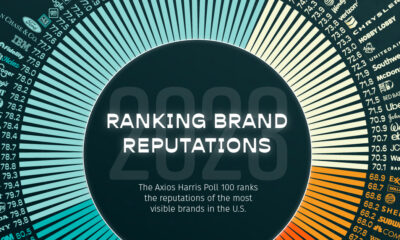
Brand Reputations: Ranking the Best and Worst in 2023