Markets
Mapped: GDP per Capita Worldwide
View the full-resolution version of this infographic


Mapped: Visualizing GDP per Capita Worldwide
View the high-resolution of the infographic by clicking here.
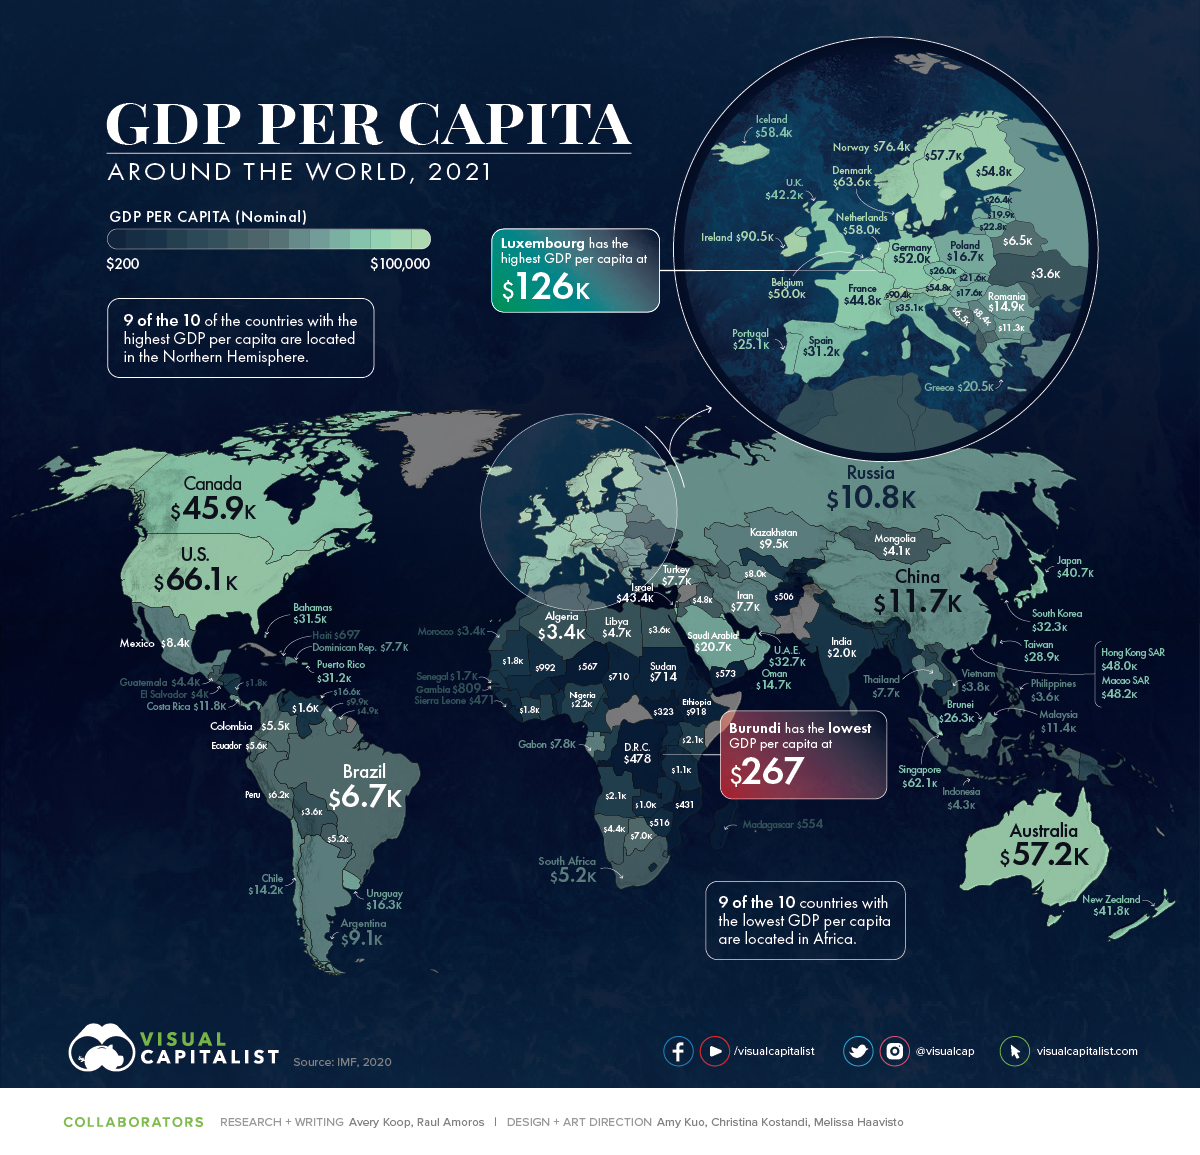
GDP per capita has steadily risen globally over time, and in tandem, the standard of living worldwide has increased immensely.
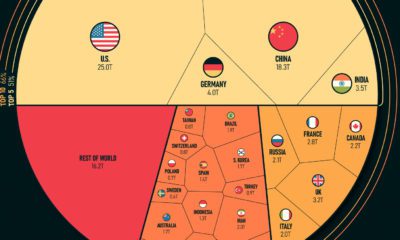
This map using data from the IMF shows the GDP per capita (nominal) of nearly every country and territory in the world.
GDP per capita is one of the best measures of a country’s wealth as it provides an understanding of how each country’s citizens live on average, showing a representation of the quantity of goods and services created per person.
The Standard of Living Over Time
Looking at history, our standard of living has increased drastically. According to Our World in Data, from 1820 to 2018, the average global GDP per capita increased by almost 15x.
Literacy rates, access to vaccines, and basic education have also improved our quality of life, while things like child mortality rates and poverty have all decreased.
For example, in 1990, 1.9 billion people lived in extreme poverty, which was 36% of the world’s population at the time. Over the last 30 years, the number has been steadily decreasing — by 2030, an estimated 479 million people will be living in extreme poverty, which according to UN population estimates, will represent only 6% of the population.
That said, economic inequality between different regions is still prevalent. In fact, the richest country today (in terms of nominal GDP per capita), Luxembourg, is over 471x more wealthy than the poorest, Burundi.
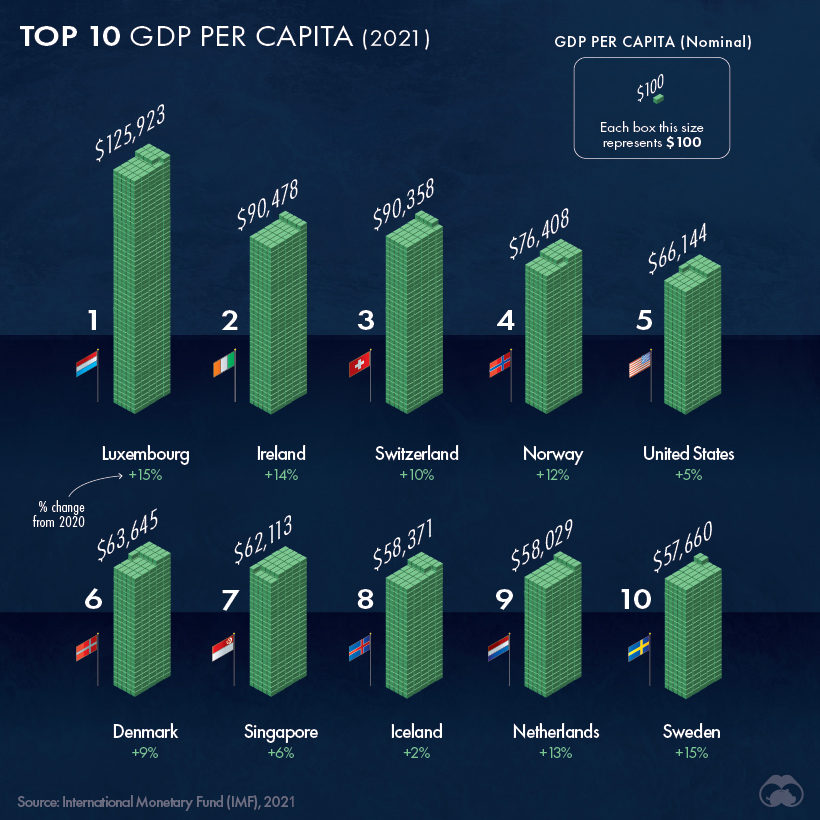
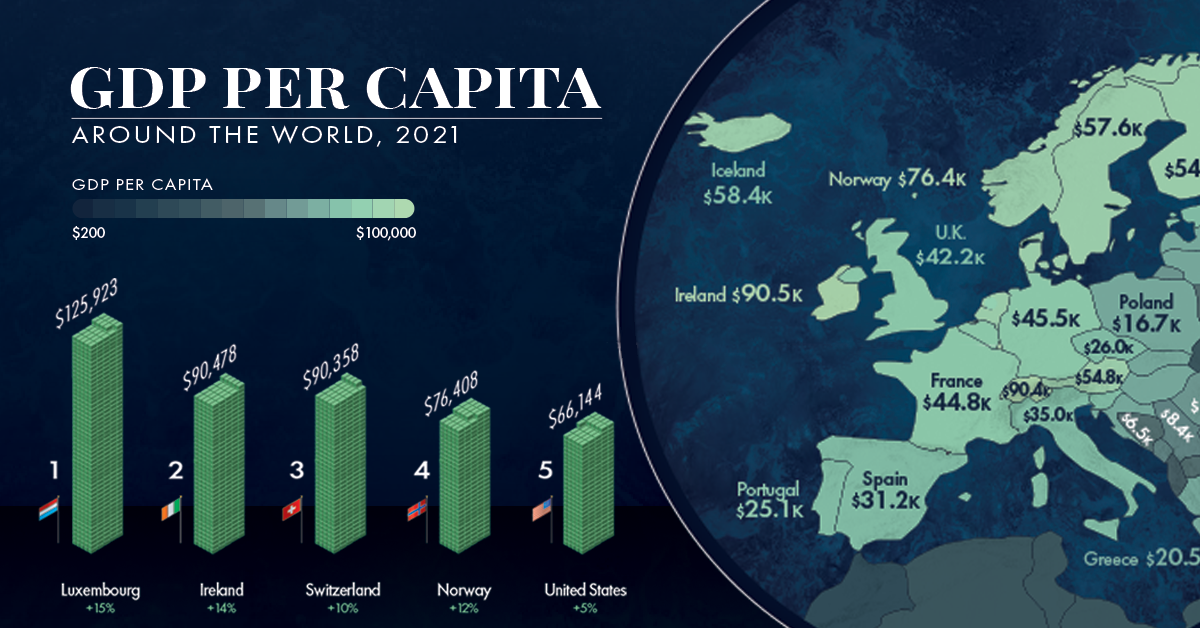
Here’s a look at the 10 countries with the highest GDP per capita in 2021:
However, not all citizens in Luxembourg are extremely wealthy. In fact:
- 29% of people spend over 40% of their income on housing costs
- 31% would be at risk of falling into poverty if they had to forgo 3 months of income
The cost of living is expensive in Luxembourg — but the standard of living in terms of goods and services produced is the highest in the world. Additionally, only 4% of the population reports low life satisfaction.
Emerging Economies and Developing Countries
Although we have never lived in a more prosperous period, and poverty rates have been declining overall, this year global extreme poverty rose for the first time in over two decades.
About 120 million additional people are living in poverty as a result of the pandemic, with the total expected to rise to about 150 million by the end of 2021.
Many of the poorest countries in the world are also considered Least Developed Countries (LDCs) by the UN. In these countries, more than 75% of the population live below the poverty line.
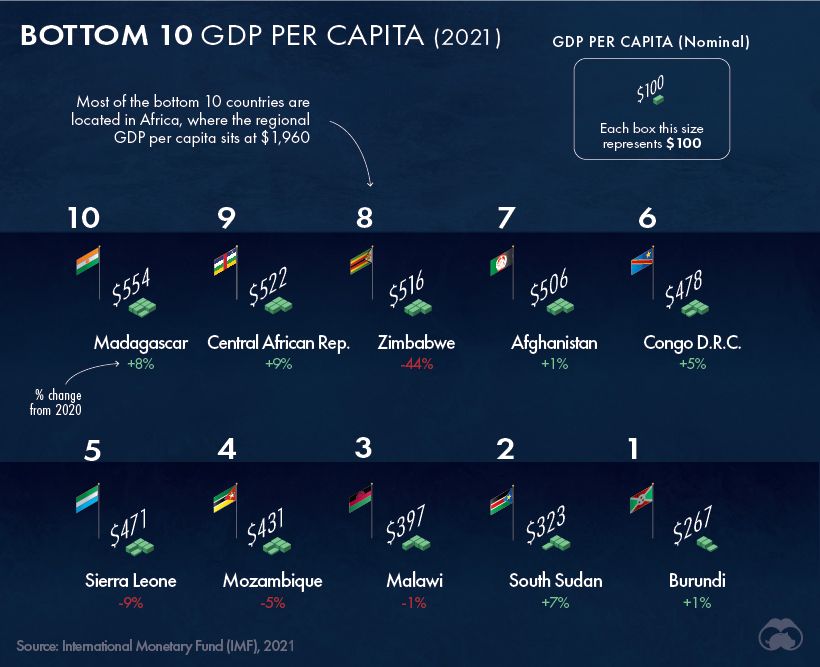
Here’s a look at the 10 countries with the lowest GDP per capita:
Life in these countries offers a stark contrast compared to the top 10. Here’s a glance at the quality of life in the poorest country, Burundi:
- 80% of the population works in agriculture
- 1 in 3 Burundians are in need of urgent humanitarian assistance
- Average households spend up to two-thirds of their income on food
However, many of the world’s poorest countries can also be classified as emerging markets with immense economic potential in the future.
In fact, China has seen the opportunity in emerging economies. Their confidence in these regions is best exemplified in the Belt and Road initiative which has funneled massive investments into infrastructure projects across multiple African countries.
Continually Raising the Bar
Prosperity is a very recent reality only characterizing the last couple hundred years. In pre-modern societies, the average person was living in conditions that would be considered extreme poverty by today’s standards.
Overall, the standard of living for everyone today is immensely improved compared to even recent history, and some countries will be experiencing rapid economic growth in the future.
GDP per Capita in 2021: Full Dataset
| Country | GDP per Capita (Nominal, 2021, USD) |
|---|---|
| 🇱🇺 Luxembourg | $125,923 |
| 🇮🇪 Ireland | $90,478 |
| 🇨🇭 Switzerland | $90,358 |
| 🇳🇴 Norway | $76,408 |
| 🇺🇸 United States | $66,144 |
| 🇩🇰 Denmark | $63,645 |
| 🇸🇬 Singapore | $62,113 |
| 🇮🇸 Iceland | $58,371 |
| 🇳🇱 Netherlands | $58,029 |
| 🇸🇪 Sweden | $57,660 |
| Australia | $57,211 |
| Qatar | $55,417 |
| Austria | $54,820 |
| Finland | $54,817 |
| Germany | $51,967 |
| Belgium | $50,051 |
| Macao SAR | $48,207 |
| Hong Kong SAR | $47,990 |
| Canada | $45,871 |
| France | $44,770 |
| San Marino | $44,676 |
| Israel | $43,439 |
| United Kingdom | $42,236 |
| New Zealand | $41,793 |
| Japan | $40,733 |
| Italy | $35,062 |
| United Arab Emirates | $32,686 |
| South Korea | $32,305 |
| Malta | $32,099 |
| The Bahamas | $31,532 |
| Puerto Rico | $31,207 |
| Spain | $31,178 |
| Europe | $31,022 |
| Cyprus | $29,686 |
| Taiwan | $28,890 |
| Slovenia | $28,734 |
| Estonia | $26,378 |
| Brunei | $26,274 |
| Czech Republic | $25,991 |
| Portugal | $25,097 |
| Bahrain | $23,710 |
| Kuwait | $23,138 |
| Lithuania | $22,752 |
| Aruba | $22,710 |
| Slovakia | $21,606 |
| Saudi Arabia | $20,742 |
| Greece | $20,521 |
| Latvia | $19,934 |
| Hungary | $17,645 |
| Barbados | $17,472 |
| Poland | $16,740 |
| Trinidad and Tobago | $16,622 |
| Saint Kitts and Nevis | $16,491 |
| Croatia | $16,402 |
| Uruguay | $16,297 |
| Romania | $14,916 |
| Antigua and Barbuda | $14,748 |
| Oman | $14,675 |
| Panama | $14,390 |
| Chile | $14,209 |
| Maldives | $14,194 |
| Palau | $13,180 |
| Seychelles | $12,648 |
| Costa Rica | $11,805 |
| China | $11,713 |
| Malaysia | $11,378 |
| Bulgaria | $11,349 |
| Russia | $10,793 |
| Saint Lucia | $10,636 |
| Grenada | $10,211 |
| Guyana | $9,913 |
| Nauru | $9,865 |
| Mauritius | $9,630 |
| Kazakhstan | $9,454 |
| Montenegro | $9,152 |
| Argentina | $9,095 |
| Turkmenistan | $8,874 |
| Serbia | $8,444 |
| Mexico | $8,403 |
| Dominica | $8,111 |
| Equatorial Guinea | $8,000 |
| Gabon | $7,785 |
| Dominican Republic | $7,740 |
| Thailand | $7,675 |
| Iran | $7,668 |
| Turkey | $7,659 |
| Saint Vincent and the Grenadines | $7,401 |
| Botswana | $7,036 |
| North Macedonia | $6,933 |
| Brazil | $6,728 |
| Bosnia and Herzegovina | $6,536 |
| Belarus | $6,513 |
| Peru | $6,229 |
| Jamaica | $5,643 |
| Ecuador | $5,589 |
| Colombia | $5,457 |
| South Africa | $5,236 |
| Paraguay | $5,207 |
| Albania | $5,161 |
| Tonga | $4,949 |
| Suriname | $4,921 |
| Fiji | $4,822 |
| Iraq | $4,767 |
| Kosovo | $4,753 |
| Libya | $4,733 |
| Georgia | $4,714 |
| Moldova | $4,527 |
| Armenia | $4,427 |
| Namibia | $4,412 |
| Azerbaijan | $4,404 |
| Guatemala | $4,385 |
| Jordan | $4,347 |
| Tuvalu | $4,296 |
| Indonesia | $4,287 |
| Mongolia | $4,139 |
| Marshall Islands | $4,092 |
| Samoa | $4,053 |
| El Salvador | $4,023 |
| Micronesia | $3,995 |
| Belize | $3,968 |
| Sri Lanka | $3,928 |
| Vietnam | $3,759 |
| Eswatini | $3,697 |
| Cabo Verde | $3,675 |
| Bolivia | $3,618 |
| Ukraine | $3,615 |
| Egypt | $3,606 |
| Philippines | $3,602 |
| North Africa | $3,560 |
| Algeria | $3,449 |
| Bhutan | $3,447 |
| Morocco | $3,409 |
| Tunisia | $3,380 |
| Djibouti | $3,275 |
| West Bank and Gaza | $3,060 |
| Vanuatu | $2,967 |
| Laos | $2,614 |
| Papua New Guinea | $2,596 |
| Honduras | $2,593 |
| Côte d'Ivoire | $2,571 |
| Solomon Islands | $2,501 |
| Ghana | $2,300 |
| Republic of Congo | $2,271 |
| Nigeria | $2,209 |
| São Tomé and Príncipe | $2,133 |
| Angola | $2,130 |
| Kenya | $2,122 |
| India | $2,031 |
| Bangladesh | $1,990 |
| Uzbekistan | $1,836 |
| Nicaragua | $1,828 |
| Kiribati | $1,817 |
| Mauritania | $1,782 |
| Cambodia | $1,680 |
| Cameroon | $1,657 |
| Senegal | $1,629 |
| Venezuela | $1,586 |
| Myanmar | $1,441 |
| Comoros | $1,431 |
| Benin | $1,400 |
| Timor-Leste | $1,273 |
| Kyrgyzstan | $1,270 |
| Nepal | $1,166 |
| Tanzania | $1,132 |
| Guinea | $1,067 |
| Lesotho | $1,018 |
| Zambia | $1,006 |
| Mali | $992 |
| Uganda | $971 |
| Ethiopia | $918 |
| Tajikistan | $851 |
| Burkina Faso | $851 |
| Guinea-Bissau | $844 |
| Rwanda | $820 |
| The Gambia | $809 |
| Togo | $759 |
| Sudan | $714 |
| Chad | $710 |
| Haiti | $698 |
| Liberia | $646 |
| Eritrea | $632 |
| Yemen | $573 |
| Niger | $567 |
| Madagascar | $554 |
| Central African Republic | $522 |
| Zimbabwe | $516 |
| Afghanistan | $506 |
| Democratic Republic of the Congo | $478 |
| Sierra Leone | $471 |
| Mozambique | $431 |
| Malawi | $397 |
| South Sudan | $323 |
| Burundi | $267 |
Editor’s note: Readers have rightly pointed out that Monaco is one of the world’s richest countries in GDP per capita (nominal) terms. This is true, but the IMF dataset excludes Monaco and lists it as “No data” each year. As a result, it is excluded from the visualization(s) above.


Markets
The 50 Best One-Year Returns on the S&P 500 (1980-2022)
The highest one-year return among the top S&P 500 stocks from 1980 to 2022 was a staggering 2,620%. Which stocks top the ranks?

The Top S&P 500 Stocks by Annual Returns
The average annual return of the S&P 500 was 10% from 1980-2022, excluding dividends. Of course, there are some companies that deliver much higher returns in any given year.
In this graphic using data from S&P Dow Jones Indices, we explore the top S&P 500 stocks with the best single year returns over the last four decades.
Ranking the Top S&P 500 Stocks
In order to find the top gainers, S&P took the top 10 best-performing stocks each year and then narrowed that list down to the top 50 overall. They ranked the top S&P 500 stocks by price returns, meaning that no dividends or stock distributions were included.
The best gains were clustered in a few select years, including the 1999 dot-com boom, the 2003 stock market rally, and the 2009 recovery from the Global Financial Crisis. None of the biggest gains happened in 2021 or 2022.
| Rank | Company | Sector | Return | Year |
|---|---|---|---|---|
| 1 | Qualcomm | Information Technology | 2620% | 1999 |
| 2 | Tesla | Consumer Discretionary | 743% | 2020 |
| 3 | DSC Communications | Communication Services | 468% | 1992 |
| 4 | Coleco Industries | Consumer Discretionary | 435% | 1982 |
| 5 | Avaya | Information Technology | 428% | 2003 |
| 6 | Chrysler | Consumer Discretionary | 426% | 1982 |
| 7 | XL Capital (Axa XL) | Financials | 395% | 2009 |
| 8 | Tenet Healthcare | Healthcare | 369% | 2009 |
| 9 | Dynegy | Utilities | 361% | 2000 |
| 10 | Advanced Micro Devices | Information Technology | 348% | 2009 |
| 11 | Sprint | Communication Services | 343% | 1999 |
| 12 | Ford | Consumer Discretionary | 337% | 2009 |
| 13 | NEXTEL Communications | Communication Services | 336% | 1999 |
| 14 | LSI Logic | Information Technology | 319% | 1999 |
| 15 | NVIDIA | Information Technology | 308% | 2001 |
| 16 | Nortel Networks | Communication Services | 304% | 1999 |
| 17 | Etsy | Consumer Discretionary | 302% | 2020 |
| 18 | Genworth Financial | Financials | 301% | 2009 |
| 19 | Micron Technology | Information Technology | 300% | 2009 |
| 20 | NetFlix | Communication Services | 298% | 2013 |
| 21 | Oracle | Information Technology | 290% | 1999 |
| 22 | Western Digital | Information Technology | 286% | 2009 |
| 23 | Network Appliance (NetApp) | Information Technology | 270% | 1999 |
| 24 | Data General | Information Technology | 267% | 1991 |
| 25 | Yahoo | Communication Services | 265% | 1999 |
| 26 | Williams Companies | Energy | 264% | 2003 |
| 27 | Novell | Information Technology | 264% | 1991 |
| 28 | Dynegy | Utilities | 263% | 2003 |
| 29 | Sun Microsystems | Information Technology | 262% | 1999 |
| 30 | PMC-Sierra | Information Technology | 262% | 2003 |
| 31 | Advanced Micro Devices | Information Technology | 259% | 1991 |
| 32 | Dell | Information Technology | 248% | 1998 |
| 33 | Global Marine | Energy | 247% | 1980 |
| 34 | Micron Technology | Information Technology | 243% | 2013 |
| 35 | Best Buy | Consumer Discretionary | 237% | 2013 |
| 36 | Reebok | Consumer Discretionary | 234% | 2000 |
| 37 | Freeport-McMoRan | Materials | 229% | 2009 |
| 38 | Biomet (Zimmer Biomet) | Healthcare | 226% | 1991 |
| 39 | NVIDIA | Information Technology | 224% | 2016 |
| 40 | Gap | Consumer Discretionary | 223% | 1991 |
| 41 | NetFlix | Communication Services | 219% | 2010 |
| 42 | Fleetwood Enterprises (Fleetwood RV) | Consumer Discretionary | 217% | 1982 |
| 43 | National Semiconductor | Information Technology | 217% | 1999 |
| 44 | Dell | Information Technology | 216% | 1997 |
| 45 | Tandy Corp (RadioShack) | Information Technology | 216% | 1980 |
| 46 | Novell | Information Technology | 215% | 2003 |
| 47 | Corning | Information Technology | 215% | 2003 |
| 48 | CB Richard Ellis (CBRE) | Real Estate | 214% | 2009 |
| 49 | AES Corp | Utilities | 213% | 2003 |
| 50 | Expedia | Consumer Discretionary | 212% | 2009 |
Qualcomm was by far the top-performer in any one calendar year window. The company had key patents for Code Division Multiple Access (CDMA) technology, which enabled fast wireless internet access and became the basis for 3G networks.
Its stock took off in 1999 as it shed less profitable business lines, resolved a patent dispute with competitor Ericsson, and joined the S&P 500 Index. At the time, CNN reported that one lucky investor who heard about Qualcomm from an investment-banker-turned-rabbi earned $17 million—roughly $30 million in today’s dollars.
The most recent stocks to make the rankings were both from 2020: well-known Tesla (#2) and lesser-known online marketplace Etsy (#17), which saw sales from independent creators surge during the early COVID-19 pandemic. The dollar value of items sold on Etsy more than doubled from $5.3 billion in 2019 to $10.3 billion in 2020, with mask sales accounting for 7% of the total.
Biggest Gainers in Each Sector
While information technology stocks made up nearly half of the list, there is representation from nine of the 11 S&P 500 sectors. No companies from the Industrials or Consumer Staples sectors made it into the ranks of the top S&P 500 stocks by annual returns.
Below, we show the stock with the best annual return for each sector.

Tesla was the top-performing Consumer Discretionary stock on the list. After meeting the requirement of four consecutive quarters of positive earnings, it joined the S&P 500 Index on December 21, 2020. The company’s performance was boosted by the announcement that it would be included in the S&P 500, along with strong performance in China, and general EV buzz as environmental regulations tightened worldwide.
In the realm of Communication Services, DSC Communications saw a sizable return in 1992. The telecommunications equipment company had contracts with major companies such as Bell and Motorola. Alcatel-Lucent (then Alcatel), a French producer of mobile phones, purchased DSC Communications in 1998.
Serial Success Stories
It’s impressive to make the list of the top S&P 500 stocks by calendar returns once, but there are seven companies that have done it twice.
Some stocks saw their repeated outperformance close together, with Dell making the ranks back-to-back in 1997 and 1998.

On the other hand, a select few have more staying power. Computing giant NVIDIA topped the charts in 2001 and triumphed again 15 years later in 2016. And this year might be another win, as the company has recently reached a $1 trillion market capitalization and has the highest year-to-date return in the S&P 500 as of July 6, 2023.
-

 Energy3 weeks ago
How Old Are the World’s Nuclear Reactors?
-

 Countries7 days ago
Mapped: World’s Top 40 Largest Military Budgets
-

 Energy3 weeks ago
How Big is the Market for Crude Oil?
-

 Crime6 days ago
Mapped: The Safest Cities in the U.S.
-

 Markets2 weeks ago
Ranked: The Most Profitable U.S. Companies, by Sector
-

 Technology5 days ago
How Long it Took for Popular Apps to Reach 100 Million Users
-

 Markets4 weeks ago
The World’s Biggest Mutual Fund and ETF Providers
-

 Markets2 weeks ago
Brand Reputations: Ranking the Best and Worst in 2023