Misc
Visualizing Women’s Economic Rights Around the World


Visualizing Women’s Economic Rights in Each Country
In recent years, many economies have made women’s rights a priority by eliminating job restrictions, working to reduce the gender wage gap, or changing legislation related to marriage and parenthood.
Still, many laws continue to inhibit women’s ability to enter the workforce or start a business—and even to travel outside their homes in the same way as men. In fact, on average globally, women have just three-quarters of the economic rights of men.
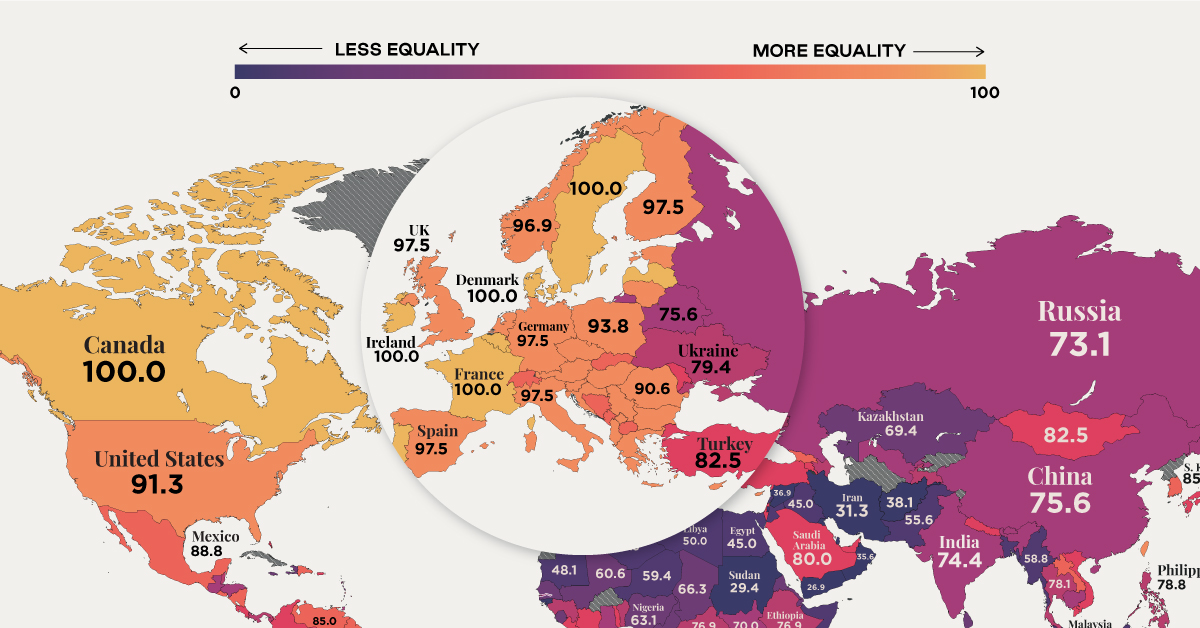
This map uses data from the Women, Business and Law 2021 report by the World Bank, to visualize women’s economic rights around the world.
Legal Protections
According to the World Bank, only 10 countries offer full legal protections to women, and all of them are in the Northern Hemisphere.
In ranking countries, the institution considers indicators like equal remuneration, legal rights, and mobility. A score of 100 means that women are on equal legal standing with men across all areas measured.
| Rank | Country/Territory | Score |
|---|---|---|
| 1 | Belgium | 100.0 |
| 1 | Canada | 100.0 |
| 1 | Denmark | 100.0 |
| 1 | France | 100.0 |
| 1 | Iceland | 100.0 |
| 1 | Ireland | 100.0 |
| 1 | Latvia | 100.0 |
| 1 | Luxembourg | 100.0 |
| 1 | Portugal | 100.0 |
| 1 | Sweden | 100.0 |
| 2 | Estonia | 97.5 |
| 2 | Finland | 97.5 |
| 2 | Germany | 97.5 |
| 2 | Greece | 97.5 |
| 2 | Italy | 97.5 |
| 2 | Netherlands | 97.5 |
| 2 | New Zealand | 97.5 |
| 2 | Spain | 97.5 |
| 2 | United Kingdom | 97.5 |
| 3 | Australia | 96.9 |
| 3 | Austria | 96.9 |
| 3 | Hungary | 96.9 |
| 3 | Norway | 96.9 |
| 3 | Slovenia | 96.9 |
| 4 | Peru | 95.0 |
| 5 | Paraguay | 94.4 |
| 6 | Croatia | 93.8 |
| 6 | Czech Republic | 93.8 |
| 6 | Lithuania | 93.8 |
| 6 | Poland | 93.8 |
| 6 | Serbia | 93.8 |
| 7 | Kosovo | 91.9 |
| 7 | Mauritius | 91.9 |
| 8 | Albania | 91.3 |
| 8 | Cyprus | 91.3 |
| 8 | Taiwan, China | 91.3 |
| 8 | United States | 91.3 |
| 9 | Bulgaria | 90.6 |
| 9 | Romania | 90.6 |
| 10 | Ecuador | 89.4 |
| 10 | Hong Kong, China | 89.4 |
| 11 | Bolivia | 88.8 |
| 11 | El Salvador | 88.8 |
| 11 | Malta | 88.8 |
| 11 | Mexico | 88.8 |
| 11 | Uruguay | 88.8 |
| 12 | Lao PDR | 88.1 |
| 12 | Montenegro | 88.1 |
| 12 | South Africa | 88.1 |
| 13 | Guyana | 86.9 |
| 13 | Zimbabwe | 86.9 |
| 14 | Cabo Verde | 86.3 |
| 14 | Dominican Republic | 86.3 |
| 14 | Namibia | 86.3 |
| 14 | Nicaragua | 86.3 |
| 14 | São Tomé and Príncipe | 86.3 |
| 15 | Georgia | 85.6 |
| 15 | Switzerland | 85.6 |
| 16 | Bosnia and Herzegovina | 85.0 |
| 16 | Brazil | 85.0 |
| 16 | Korea, Rep. | 85.0 |
| 16 | North Macedonia | 85.0 |
| 16 | Slovak Republic | 85.0 |
| 16 | Venezuela | 85.0 |
| 17 | Moldova | 84.4 |
| 17 | Togo | 84.4 |
| 18 | Liberia | 83.8 |
| 18 | Puerto Rico (US) | 83.8 |
| 18 | St. Lucia | 83.8 |
| 19 | Costa Rica | 83.1 |
| 19 | Côte d'Ivoire | 83.1 |
| 19 | Timor-Leste | 83.1 |
| 20 | Armenia | 82.5 |
| 20 | Fiji | 82.5 |
| 20 | Mongolia | 82.5 |
| 20 | Mozambique | 82.5 |
| 20 | Singapore | 82.5 |
| 20 | Turkey | 82.5 |
| 20 | United Arab Emirates | 82.5 |
| 21 | Colombia | 81.9 |
| 21 | Japan | 81.9 |
| 21 | Vietnam | 81.9 |
| 22 | Bahamas | 81.3 |
| 22 | Tanzania | 81.3 |
| 22 | Zambia | 81.3 |
| 23 | Grenada | 80.6 |
| 23 | Israel | 80.6 |
| 23 | Kenya | 80.6 |
| 23 | Nepal | 80.6 |
| 23 | Rwanda | 80.6 |
| 24 | Chile | 80.0 |
| 24 | Samoa | 80.0 |
| 24 | San Marino | 80.0 |
| 24 | Saudi Arabia | 80.0 |
| 25 | Belize | 79.4 |
| 25 | Burkina Faso | 79.4 |
| 25 | Panama | 79.4 |
| 25 | Ukraine | 79.4 |
| 26 | Azerbaijan | 78.8 |
| 26 | Congo, Dem. Rep. | 78.8 |
| 26 | Kiribati | 78.8 |
| 26 | Philippines | 78.8 |
| 26 | Tajikistan | 78.8 |
| 27 | Lesotho | 78.1 |
| 27 | Thailand | 78.1 |
| 28 | Benin | 77.5 |
| 28 | Malawi | 77.5 |
| 29 | Barbados | 76.9 |
| 29 | Central African Republic | 76.9 |
| 29 | Ethiopia | 76.9 |
| 29 | Kyrgyz Republic | 76.9 |
| 30 | Argentina | 76.3 |
| 30 | Guinea | 76.3 |
| 30 | Seychelles | 76.3 |
| 31 | Belarus | 75.6 |
| 31 | China | 75.6 |
| 31 | Morocco | 75.6 |
| 32 | Cambodia | 75.0 |
| 32 | Ghana | 75.0 |
| 32 | Honduras | 75.0 |
| 32 | Trinidad and Tobago | 75.0 |
| 33 | Gambia | 74.4 |
| 33 | India | 74.4 |
| 33 | Madagascar | 74.4 |
| 34 | Maldives | 73.8 |
| 34 | Suriname | 73.8 |
| 35 | Angola | 73.1 |
| 35 | Burundi | 73.1 |
| 35 | Russia | 73.1 |
| 35 | Uganda | 73.1 |
| 36 | Bhutan | 71.9 |
| 37 | St. Kitts and Nevis | 71.3 |
| 38 | Guatemala | 70.6 |
| 38 | Uzbekistan | 70.6 |
| 39 | South Sudan | 70.0 |
| 40 | Eritrea | 69.4 |
| 40 | Kazakhstan | 69.4 |
| 40 | Sierra Leone | 69.4 |
| 41 | Dijibouti | 68.1 |
| 41 | Jamaica | 68.1 |
| 41 | Marshall Islands | 68.1 |
| 41 | St. Vicent and the Grenadines | 68.1 |
| 42 | Tunisia | 67.5 |
| 43 | Senegal | 66.9 |
| 44 | Antigua and Barbuda | 66.3 |
| 44 | Chad | 66.3 |
| 45 | Sri Lanka | 65.6 |
| 46 | Comoros | 65.0 |
| 47 | Indonesia | 64.4 |
| 48 | Botswana | 63.8 |
| 48 | Haiti | 63.8 |
| 48 | Micronesia | 63.8 |
| 49 | Nigeria | 63.1 |
| 50 | Dominica | 62.5 |
| 51 | Mali | 60.6 |
| 52 | Cameroon | 60.0 |
| 52 | Papua New Guinea | 60.0 |
| 53 | Niger | 59.4 |
| 54 | Myanmar | 58.8 |
| 54 | Palau | 58.8 |
| 54 | Tonga | 58.8 |
| 55 | Vanuatu | 58.1 |
| 56 | Algeria | 57.5 |
| 56 | Gabon | 57.5 |
| 57 | Solomon Islands | 56.9 |
| 58 | Bahrain | 55.6 |
| 58 | Pakistan | 55.6 |
| 59 | Brunei Darussalam | 53.1 |
| 60 | Lebanon | 52.5 |
| 61 | Equatorial Guinea | 51.9 |
| 62 | Libya | 50.0 |
| 62 | Malaysia | 50.0 |
| 63 | Bangladesh | 49.4 |
| 63 | Congo, Rep. | 49.4 |
| 64 | Mauritania | 48.1 |
| 65 | Jordan | 46.9 |
| 65 | Somalia | 46.9 |
| 66 | Eswatini | 46.3 |
| 67 | Egypt | 45.0 |
| 67 | Iraq | 45.0 |
| 68 | Guinea-Bissau | 42.5 |
| 69 | Afghanistan | 38.1 |
| 70 | Syria | 36.9 |
| 71 | Oman | 35.6 |
| 72 | Iran | 31.3 |
| 73 | Qatar | 29.4 |
| 73 | Sudan | 29.4 |
| 74 | Kuwait | 28.8 |
| 75 | Yemen | 26.9 |
| 76 | West Bank and Gaza | 26.3 |
According to the report, there are 20 economies in the world where women still have half or fewer of the legal economic rights of men.
Under Taliban rule, for example, women in Afghanistan have limited access to education and work. In the Gaza Strip, women must have the permission of a male guardian to travel.
Yet, some differences are also seen in developed countries.
In the U.S, women still earn an average of about 82 cents for each dollar earned by men, and the gap across many countries in Europe is similar. Meanwhile, women are represented in just 23% of seats in national parliaments globally, and make up just 13% of agricultural landholders.
The Shadow Pandemic
COVID-19 has exacerbated existing inequalities that disadvantage girls and women, including barriers to attend school and maintain jobs, according to the United Nations.
In fact, new research shows that the sectors that have been most affected by the pandemic so far are those with high levels of women workers, including the restaurant and hospitality business, as well as the travel sector.
While leaders debate recovery in a post-pandemic world, rights equality remains a central topic for social and economic development.


Politics
How Do Chinese Citizens Feel About Other Countries?
What is the Chinese public’s view of world powers? This visual breaks down Chinese sentiment towards other countries.
Public Opinion: How Chinese Citizens Feel About Other Countries
Tensions over Taiwan, the COVID-19 pandemic, trade, and the war in Ukraine have impacted Chinese sentiment towards other countries.
This visualization uses data from the Center for International Security and Strategy (CISS) at Tsinghua University to rank survey responses from the Chinese public on their attitudes towards countries and regions around the world.
Chinese Sentiment Towards Other Countries in 2023
In the Center’s opinion polls, which surveyed a random sample of more than 2,500 Chinese mainland adults in November 2022, Russia came out significantly ahead.
Just under 60% of respondents held Russia in a favorable view, with 19% seeing the country as “very favorable.” Contrast that to the mere 12% that viewed the U.S. in a positive light.
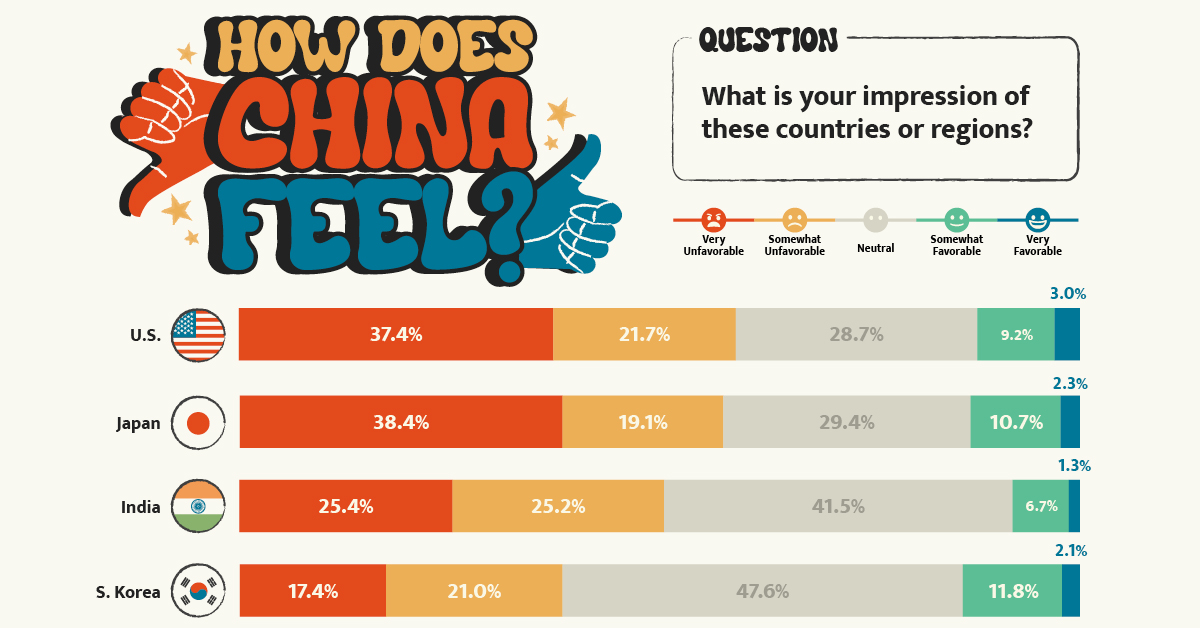
Here’s a closer look at the data. The percentages refer to the share of respondents that voted for said category.
| Country/Region | Very Unfavorable | Somewhat Unfavorable | Neutral | Somewhat Favorable | Very Favorable |
|---|---|---|---|---|---|
| 🇺🇸 United States | 37.4% | 21.7% | 28.7% | 9.2% | 3.0% |
| 🇯🇵 Japan | 38.4% | 19.1% | 29.4% | 10.7% | 2.3% |
| 🇮🇳 India | 25.4% | 25.2% | 41.5% | 6.7% | 1.3% |
| 🇰🇷 South Korea | 17.4% | 21.0% | 47.6% | 11.8% | 2.1% |
| 🇪🇺 European Union | 9.3% | 15.6% | 57.6% | 14.1% | 3.3% |
| Southeast Asia | 7.1% | 13.1% | 59.5% | 16.8% | 3.5% |
| 🇷🇺 Russia | 3.0% | 4.8% | 33.7% | 39.4% | 19.0% |
Japan ranked just below the U.S. in terms of overall unfavorability, though a slightly higher share of respondents saw Japan as “very unfavorable” compared to America. This is likely due to both modern tensions in the East China Sea over mutually claimed islands and historical tensions over the Sino-Japanese Wars.
Chinese sentiment towards India was also unfavorable at just over 50%, though notably the country also received the lowest favorability rating at just 8%.
Additional Survey Findings
The survey also found that 39% of Chinese people get their information on international security from Chinese state-run media (mainly through TV), with an additional 19% getting information from government websites and official social accounts. Conversely, only 1.7% get their news from foreign websites and foreign social media, partially due to the Great Firewall.
When asked about different international security issues, the biggest shares of Chinese citizens ranked the following as their top three:
- Pandemics (12.9%)
- Disputes over territory and territorial waters (12.9%)
- China-U.S. relations (12.0%)
The pandemic’s high score reflects the harsher impact COVID-19 had on China. Chinese borders were shut for years and the public faced intense measures to reduce spread.
In terms of other world events, the majority of Chinese people align with a more “Eastern” viewpoint. For example, in regards to the war in Ukraine, the report found that:
“About 80 percent of the respondents believe the U.S. and Western countries should be held most accountable [for the war], while less than ten percent of the respondents argue that Russia is mainly responsible.”– Center for International Security and Strategy, Tsinghua University
Overall, the views of the Chinese public reflect the opposite of those found in many Western countries. They provide an important insight that it is not just the Chinese government holding particular views about the world, but the Chinese public as well.
-

 Markets2 weeks ago
Visualizing 1 Billion Square Feet of Empty Office Space
-

 Energy4 weeks ago
Life Cycle Emissions: EVs vs. Combustion Engine Vehicles
-

 Maps2 weeks ago
Vintage Viz: The World’s Rivers and Lakes, Organized Neatly
-

 Finance3 weeks ago
Visualized: The 100 Largest U.S. Banks by Consolidated Assets
-

 Automation1 week ago
Charted: Changing Sentiments Towards AI in the Workplace
-

 VC+3 weeks ago
What are Top Investment Managers Holding in Their Portfolios?
-

 Stocks1 week ago
The 50 Best One-Year Returns on the S&P 500 (1980-2022)
-

 United States3 weeks ago
Chart: U.S. Home Price Growth Over 50 Years