Money
Household Income Distribution in the U.S. Visualized as 100 Homes


Household Income Distribution in the U.S. Visualized as 100 Homes
Income inequality and wealth disparity have been frequent topics of conversation, even before the pandemic upended the economy.
Now, rising inflation and interest rates, and a possible recession on the horizon are bringing these societal divides into sharp focus.
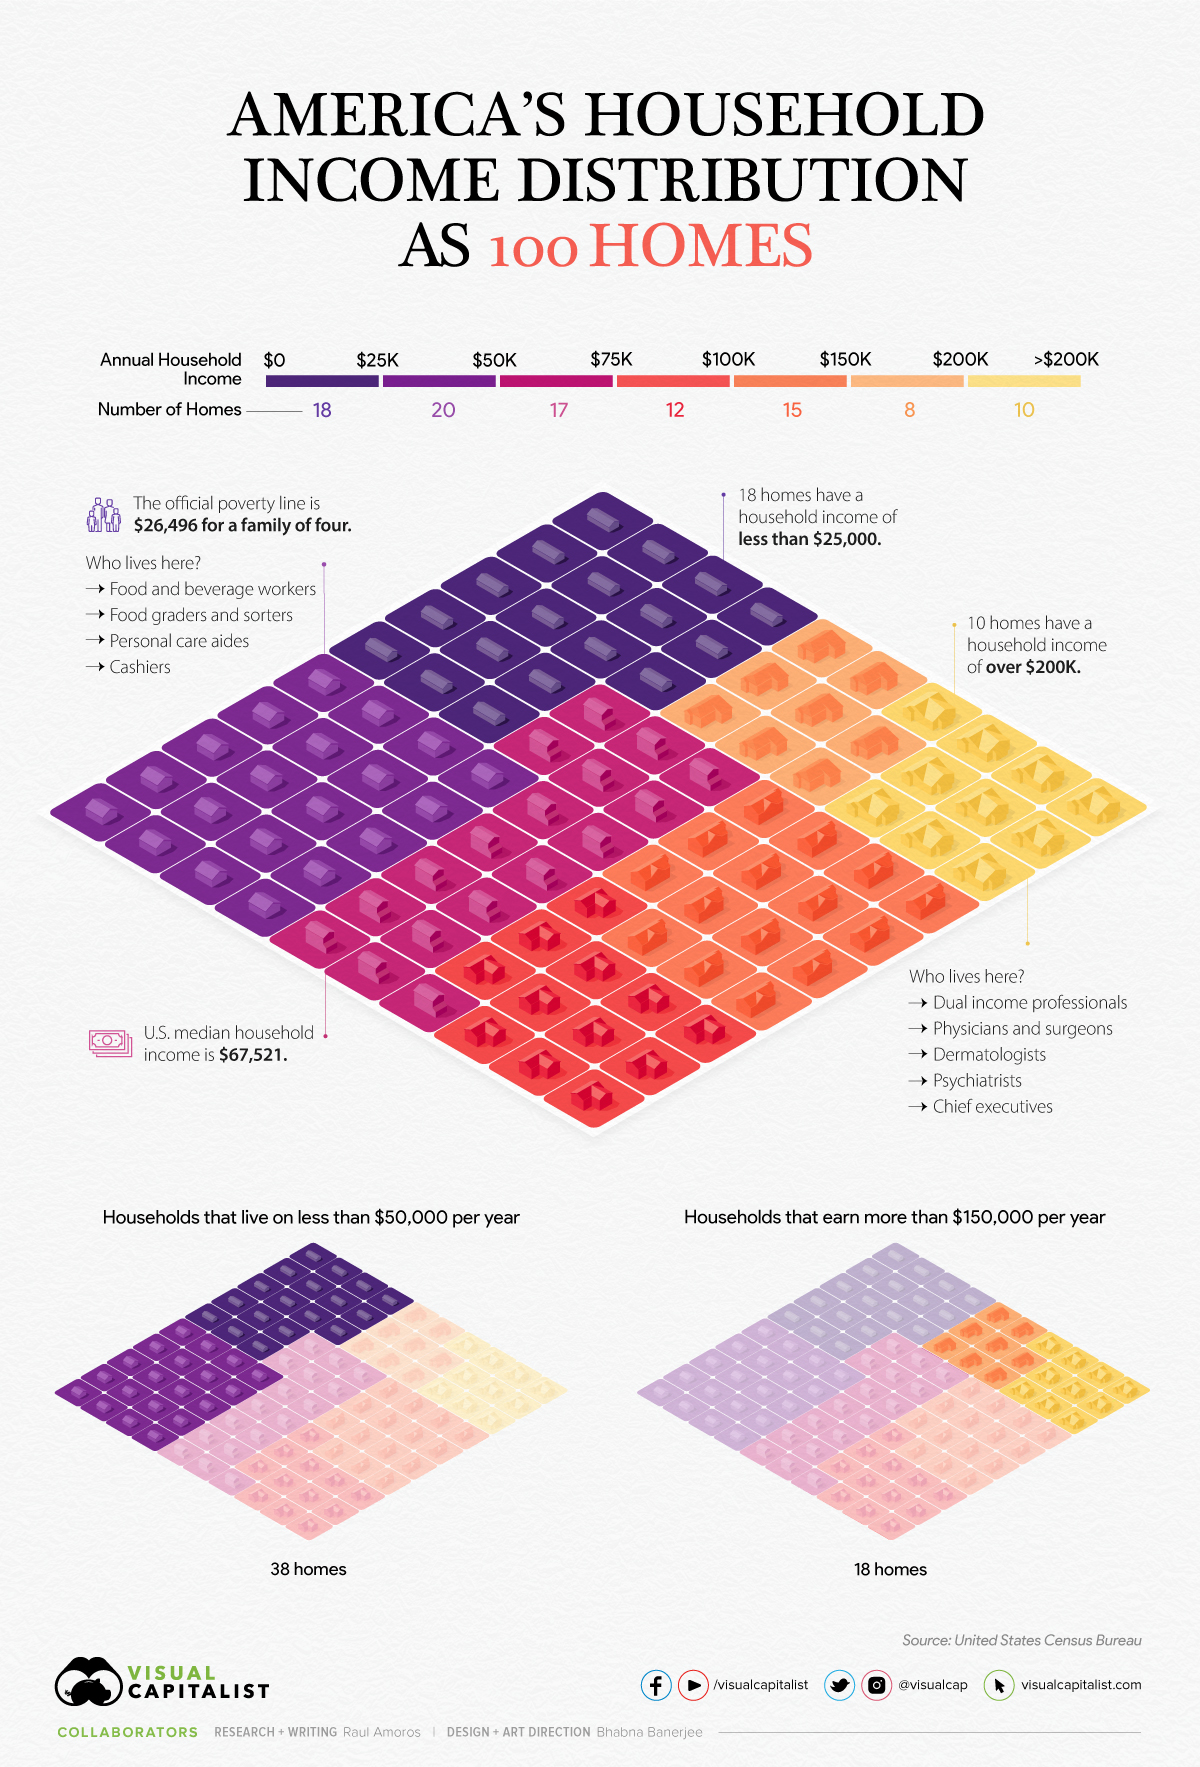
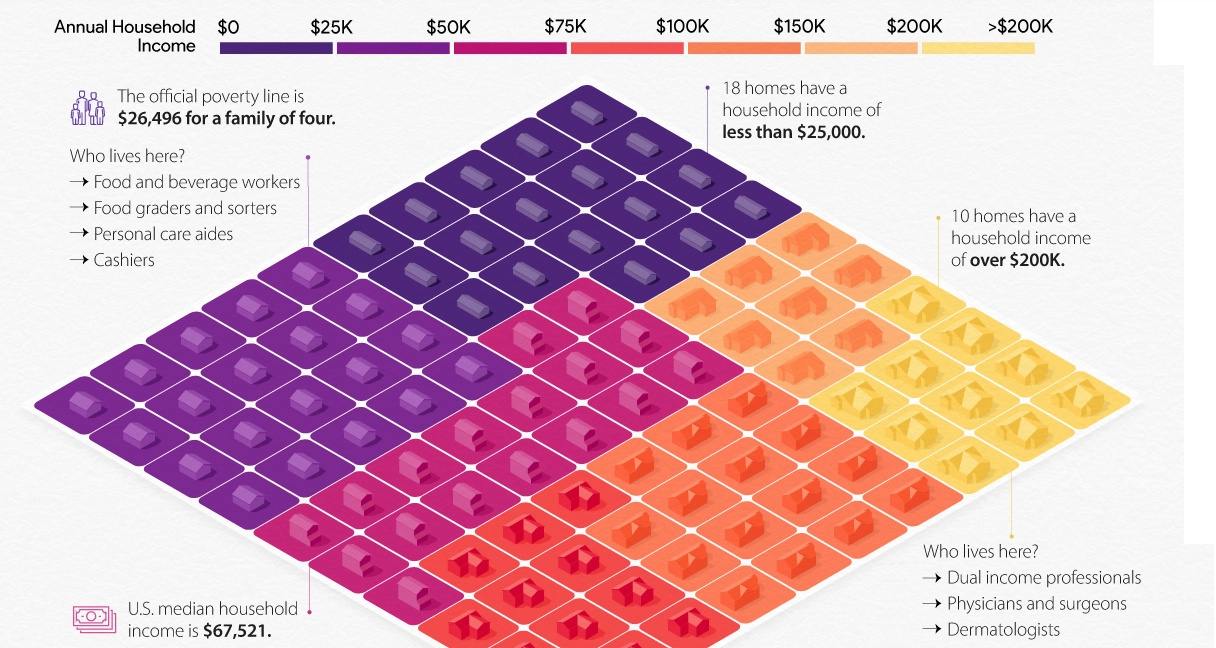
In the above visualization, U.S. households are parsed out into a neighborhood of 100 homes and then grouped by income brackets, using recent data from the U.S. Census Bureau.
The Neighborhood Breakdown
American households vary widely on their respective incomes. The largest cluster of homes, representing nearly 20% of all American households, are in the $25-$49.9k income bracket.
Here’s a look at the share of households in each income bracket and the number of homes they represent.
| Household Income | Share of Total | Number of Homes |
|---|---|---|
| Under $25K | 18.1% | 18 |
| $25K-$49.9K | 19.7% | 20 |
| $50K-$74.9K | 16.5% | 17 |
| $75K-99.9K | 12.2% | 12 |
| $100K-$149.9K | 15.3% | 15 |
| $150k-$199.9K | 8.0% | 8 |
| Over $200K | 10.3% | 10 |
In our hypothetical neighborhood, 18 of the households are in the lowest income bracket. People in this category have a wide variety of jobs, but personal care aides, cashiers, food and beverage positions are some of the most common. As a point of reference, the poverty line for a family of four currently sits at $26,496.
On the flip side, in this small community of 100 houses, 33 earn six figures and typically have at least one family member in a corporate or medical role.
The American Middle Class
The middle class in America has shrunk significantly in the past 50 years, going from 61% of adults being middle income in 1971 to 50% in 2021.
Here’s a look at the economic class breakdowns by annual household income, based on households with three people (Note: the average U.S. household has 2.6 people):
- Upper class: >$156,000
- Middle class: $52,000-$156,000
- Lower class: <$52,000
Although these definitions and conditions don’t align exactly with the buckets we use in the main houses visualization, they come pretty close.
In the neighborhood of 100 homes, 38 homes could be considered low income, while 18 are high income. Meanwhile, sitting in the $50-149.9k middle range of household income are 44 homes.
The Larger Trends
The pandemic had an extremely adverse impact on earnings and income worldwide, and the U.S. was no exception.
Median household income decreased 2.9% to $67.5k between 2019 and 2020, the first decrease since 2014. Additionally, the number of people who worked full-time jobs, year-round decreased by around 13.7 million.
That said, when looking at the longer-term trend, the median income for those considered middle class has jumped by 50% over the last five decades. Here’s a look at the median incomes in each economic class in 1970 vs. 2020:
| 1970 Median Household Income (in 2020 $) | 2020 Median Household Income | % Change | |
|---|---|---|---|
| Low Income | $20,604 | $29,963 | 45% |
| Middle Income | $59,934 | $90,131 | 50% |
| Upper Income | $130,008 | $219,572 | 69% |
With a recession highly likely to occur in the U.S., and rising inflation causing increases in the cost of basic, everyday goods, budgets may get tighter for many households in America, and incomes are likely to be impacted as well.


Money
Animated: Change in Russian Billionaires’ Wealth Since 2022
How have Russian billionaires fared since Russia’s invasion of Ukraine? This animation tracks the wealth of 22 Russian billionaires.
 Creator Program
Animated: Change in Russian Billionaires’ Wealth Since 2022
When Russia invaded Ukraine in February 2022, many countries retaliated with sanctions targeting Russian billionaires—the oligarchs—and politicians directly.
And as the war has progressed, those sanctions have intensified, with even the relatives and shell companies of these billionaires being targeted over time. The reason? These oligarchs are interconnected to Russia’s government, lending vocal and fiscal support in exchange for sweetheart deals or beneficial government oversight.
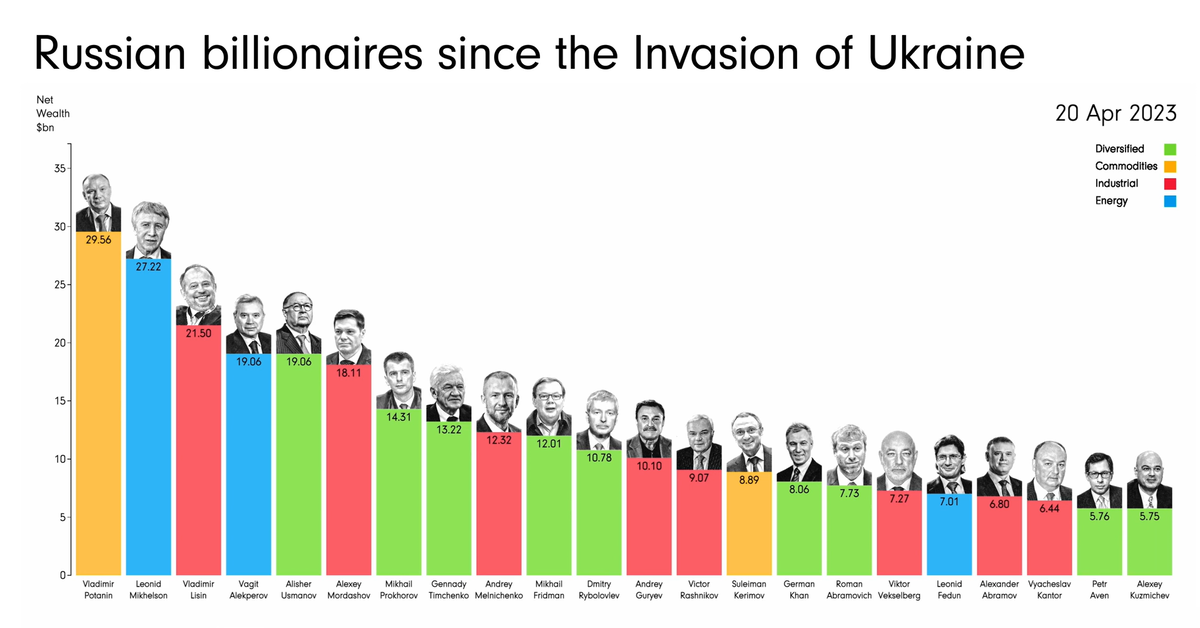
This animation from James Eagle shows how the estimated net wealth of the 22 wealthiest Russian billionaires on the Bloomberg Billionaires Index in April 2023 has changed since January 2022, prior to the start of the conflict.
Net Wealth of Top Russian Billionaires
The 22 wealthiest Russian billionaires in April 20, 2023 lost a collective $90.4 billion in net worth since January 5, 2022.
| Rank | Name | Main Industry | Net Wealth (Apr 20, 2023) | Net Wealth (Jan 5, 2022) | % Change |
|---|---|---|---|---|---|
| 1 | Vladimir Potanin | Commodities | $29.6B | $31.1B | -4.8% |
| 2 | Leonid Mikhelson | Energy | $27.2B | $33.2B | -18.1% |
| 3 | Vladimir Lisin | Industrial | $21.5B | $28.0B | -23.2% |
| 4 | Vagit Alekperov | Energy | $19.1B | $22.8B | -16.2% |
| 5 | Alisher Usmanov | Diversified | $19.1B | $21.2B | -9.9% |
| 6 | Alexey Mordashov | Industrial | $18.1B | $29.1B | -37.8% |
| 7 | Mikhail Prokhorov | Diversified | $14.3B | $14.0B | 2.1% |
| 8 | Gennady Timchenko | Diversified | $13.2B | $23.1B | -42.9% |
| 9 | Andrey Melnichenko | Industrial | $12.3B | $17.8B | -30.9% |
| 10 | Mikhail Fridman | Diversified | $12.0B | $14.1B | -14.9% |
| 11 | Dmitry Rybolovlev | Diversified | $10.8B | $11.2B | -3.6% |
| 12 | Andrey Guryev | Industrial | $10.1B | $8.0B | 26.3% |
| 13 | Victor Rashnikov | Industrial | $9.1B | $14.4B | -36.8% |
| 14 | Suleiman Kerimov | Commodities | $8.9B | $15.2B | -41.4% |
| 15 | German Khan | Diversified | $8.1B | $9.6B | -15.6% |
| 16 | Roman Abramovich | Diversified | $7.7B | $18.2B | -57.7% |
| 17 | Viktor Vekselberg | Industrial | $7.3B | $18.6B | -60.8% |
| 18 | Leonid Fedun | Energy | $7.0B | $8.9B | -21.3% |
| 19 | Alexander Abramov | Industrial | $6.8B | $9.1B | -25.3% |
| 20 | Vyacheslav Kantor | Industrial | $6.4B | $9.1B | -29.7% |
| 21 | Petr Aven | Diversified | $5.8B | $6.6B | -12.1% |
| 22 | Alexey Kuzmichev | Diversified | $5.8B | $7.3B | -20.5% |
The heaviest hit include Viktor Vekselberg, who holds a stake in UC Rusal, the world’s third largest aluminum producer. Since the start of the war, he’s lost an estimated $11.3 billion or 61% of his net worth from January 2022.
Roman Abramovich, who got his start in the early oligarchy through oil conglomerates, was also hit hard by the sanctions. He lost $10.5 billion or 58% of his net worth from January 2022, and was forced to sell Chelsea Football Club in one of the biggest sports team sales in history.
Notably, the richest oligarchs haven’t lost as much. Mining giant Norilsk Nickel’s largest shareholder, Vladimir Potanin, saw his net worth only drop by 4.8%. After being hit hard at the onset of the war in Ukraine, he quickly rebounded and at many times had an even higher net worth, reaching $35.6 billion in June 2022.
And a few oligarchs, like former Norilsk Nickel CEO Mikhail Prokhorov and phosphate-based fertilizer baron Andrey Guryev, saw their wealth increase since January 2022. Guryev grew his net worth by $2 billion or 26%, while Prokhorov (who formerly owned the NBA’s Brooklyn Nets) saw his net worth even out at a gain of $0.3 billion or 2%.
Oligarch Support of Russia (or Lack Thereof)
As Russia’s war with Ukraine has dragged on, and sanctions have continued to weigh on Russian billionaires, politicians, and companies, their effects have been uncertain.
Oligarchs have lost net worth, relinquished foreign businesses, and even had prized possessions like mansions and yachts seized. At the same time, though Russia’s economy has weakened under sanctions, bolstered trade with countries like China, India, and Saudi Arabia have kept it stronger than expected.
And though some oligarchs have voiced various concerns over the ongoing war, the wealthiest have been careful to toe the line. Russian billionaires and politicians that did vocalize criticism, including Lukoil chairman Ravil Maganov, have been found dead in apparent suicides, heart attacks, and accidents.
The most serious oligarch rebellion wasn’t due to economic hardships, but military operations. Oligarch and mercenary leader Yevgeny Prigozhin launched an attempted coup in June 2023, reportedly retreating after support from within Russia’s military quickly fizzled.

-

 Environment5 days ago
Hotter Than Ever: 2023 Sets New Global Temperature Records
-

 Datastream4 weeks ago
Can You Calculate Your Daily Carbon Footprint?
-

 Energy2 weeks ago
Who’s Still Buying Russian Fossil Fuels in 2023?
-

 VC+4 days ago
What’s New on VC+ in July
-

 Markets4 weeks ago
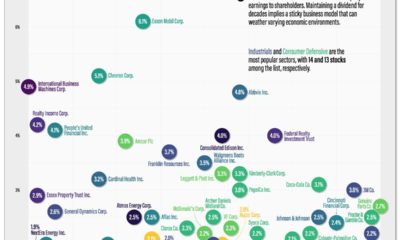
Visualizing BlackRock’s Top Equity Holdings
-

 Technology2 weeks ago
Meet the Competing Apps Battling for Twitter’s Market Share
-

 China16 hours ago
How Do Chinese Citizens Feel About Other Countries?
-

 Markets4 weeks ago
Visualizing Every Company on the S&P 500 Index